29
/it/
it
AIzaSyAYiBZKx7MnpbEhh9jyipgxe19OcubqV5w
April 1, 2024
53677
Other small states
OSS
false
2
1
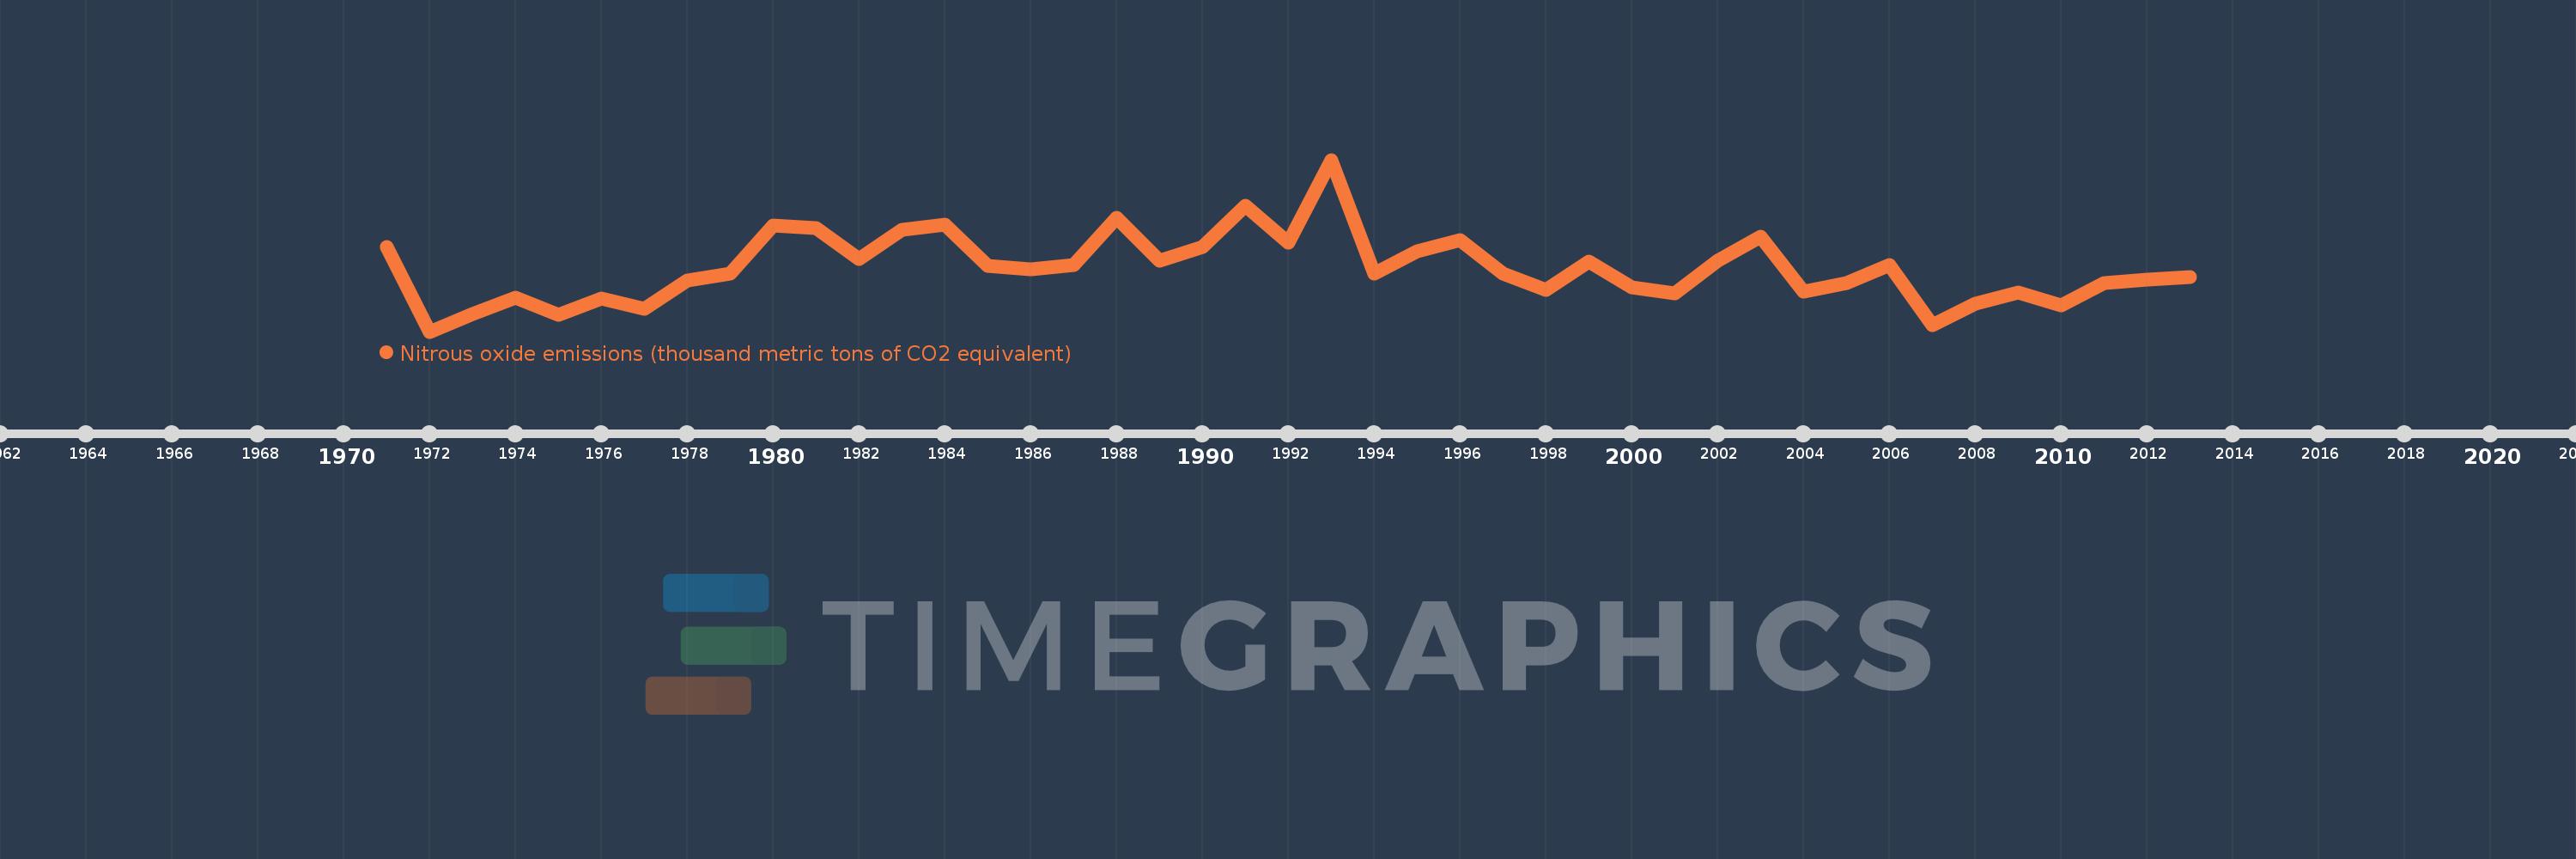
Nitrous oxide emissions (thousand metric tons of CO2 equivalent)
2013,2012,2011,2010,2009,2008,2007,2006,2005,2004,2003,2002,2001,2000,1999,1998,1997,1996,1995,1994,1993,1992,1991,1990,1989,1988,1987,1986,1985,1984,1983,1982,1981,1980,1979,1978,1977,1976,1975,1974,1973,1972,1971
Queste statistiche in altri paesi:
AfghanistanAlbaniaAlgeriaAmerican SamoaAndorraAngolaAntigua and BarbudaArab WorldArgentinaArmeniaArubaAustraliaAustriaAzerbaijanBahamas, TheBahrainBangladeshBarbadosBelarusBelgiumBelizeBeninBermudaBhutanBoliviaBosnia and HerzegovinaBotswanaBrazilBritish Virgin IslandsBrunei DarussalamBulgariaBurkina FasoBurundiCabo VerdeCambodiaCameroonCanadaCaribbean small statesCayman IslandsCentral African RepublicCentral Europe and the BalticsChadChileChinaColombiaComorosCongo, Dem. Rep.Congo, Rep.Costa RicaCote d'IvoireCroatiaCubaCyprusCzech RepublicDenmarkDjiboutiDominicaDominican RepublicEarly-demographic dividendEast Asia & PacificEast Asia & Pacific (excluding high income)East Asia & Pacific (IDA & IBRD countries)EcuadorEgypt, Arab Rep.El SalvadorEquatorial GuineaEritreaEstoniaEthiopiaEuro areaEurope & Central AsiaEurope & Central Asia (excluding high income)Europe & Central Asia (IDA & IBRD countries)European UnionFaroe IslandsFijiFinlandFragile and conflict affected situationsFranceFrench PolynesiaGabonGambia, TheGeorgiaGermanyGhanaGibraltarGreeceGreenlandGrenadaGuamGuatemalaGuineaGuinea-BissauGuyanaHaitiHeavily indebted poor countries (HIPC)High incomeHondurasHong Kong SAR, ChinaHungaryIBRD onlyIcelandIDA & IBRD totalIDA blendIDA onlyIDA totalIndiaIndonesiaIran, Islamic Rep.IraqIrelandIsraelItalyJamaicaJapanJordanKazakhstanKenyaKiribatiKorea, Dem. People’s Rep.Korea, Rep.KosovoKuwaitKyrgyz RepublicLao PDRLate-demographic dividendLatin America & Caribbean Latin America & Caribbean (excluding high income)Latin America & the Caribbean (IDA & IBRD countries)LatviaLeast developed countries: UN classificationLebanonLesothoLiberiaLibyaLithuaniaLow & middle incomeLow incomeLower middle incomeLuxembourgMacao SAR, ChinaMacedonia, FYRMadagascarMalawiMalaysiaMaldivesMaliMaltaMarshall IslandsMauritaniaMauritiusMexicoMicronesia, Fed. Sts.Middle East & North AfricaMiddle East & North Africa (excluding high income)Middle East & North Africa (IDA & IBRD countries)Middle incomeMoldovaMongoliaMontenegroMoroccoMozambiqueMyanmarNamibiaNauruNepalNetherlandsNew CaledoniaNew ZealandNicaraguaNigerNigeriaNorth AmericaNorthern Mariana IslandsNorwayOECD membersOmanOther small statesPacific island small statesPakistanPalauPanamaPapua New GuineaParaguayPeruPhilippinesPolandPortugalPost-demographic dividendPre-demographic dividendPuerto RicoQatarRomaniaRussian FederationRwandaSamoaSao Tome and PrincipeSaudi ArabiaSenegalSerbiaSeychellesSierra LeoneSingaporeSlovak RepublicSloveniaSmall statesSolomon IslandsSomaliaSouth AfricaSouth AsiaSouth Asia (IDA & IBRD)SpainSri LankaSt. Kitts and NevisSt. LuciaSt. Vincent and the GrenadinesSub-Saharan Africa Sub-Saharan Africa (excluding high income)Sub-Saharan Africa (IDA & IBRD countries)SudanSurinameSwazilandSwedenSwitzerlandSyrian Arab RepublicTajikistanTanzaniaThailandTimor-LesteTogoTongaTrinidad and TobagoTunisiaTurkeyTurkmenistanTurks and Caicos IslandsTuvaluUgandaUkraineUnited Arab EmiratesUnited KingdomUnited StatesUpper middle incomeUruguayUzbekistanVanuatuVenezuela, RBVietnamVirgin Islands (U.S.)WorldYemen, Rep.ZambiaZimbabwe Linea del tempo:
Questa scala temporale mostra un grafico dal 1971 anno al 2013 anno. Other small states. I dati fino ad 1970 anno non disponibili. Il numero di osservazioni attuali secondo i date: 43.
La fonte (nome):
Indicatori dello sviluppo mondiale
La fonte (organizzazione):
European Commission, Joint Research Centre (JRC)/Netherlands Environmental Assessment Agency (PBL). Emission Database for Global Atmospheric Research (EDGAR): http://edgar.jrc.ec.europa.eu/
Categorie:
Climate Change, Environment
sono stati aggiornati
23 apr 2017 anni
Indicatori delle variazioni dei valori per anni
Minima:
10.147 Mille.
1 gen 1972 anni
Massimo:
17.685 Mille.
1 gen 1993 anni
Alla data di osservazione
Valore
Variazione assoluta
La variazione rispetto al valore precedente
1 gen 1971 anni
13.875 Mille.
+13.875 Mille.
0.0%
1 gen 1972 anni
10.147 Mille.
-3.728 Mille.
-26.87%
1 gen 1973 anni
10.919 Mille.
+772.008
7.61%
1 gen 1974 anni
11.626 Mille.
+707.005
6.47%
1 gen 1975 anni
10.879 Mille.
-747.129
-6.43%
1 gen 1976 anni
11.608 Mille.
+728.967
6.7%
1 gen 1977 anni
11.155 Mille.
-453.32
-3.91%
1 gen 1978 anni
12.399 Mille.
+1.244 Mille.
11.15%
1 gen 1979 anni
12.684 Mille.
+285.301
2.3%
1 gen 1980 anni
14.814 Mille.
+2.13 Mille.
16.79%
1 gen 1981 anni
14.693 Mille.
-120.724
-0.81%
1 gen 1982 anni
13.314 Mille.
-1.379 Mille.
-9.39%
1 gen 1983 anni
14.621 Mille.
+1.308 Mille.
9.82%
1 gen 1984 anni
14.849 Mille.
+228.209
1.56%
1 gen 1985 anni
13.025 Mille.
-1.824 Mille.
-12.28%
1 gen 1986 anni
12.881 Mille.
-144.452
-1.11%
1 gen 1987 anni
13.076 Mille.
+194.694
1.51%
1 gen 1988 anni
15.147 Mille.
+2.071 Mille.
15.84%
1 gen 1989 anni
13.25 Mille.
-1.897 Mille.
-12.53%
1 gen 1990 anni
13.852 Mille.
+602.26
4.55%
1 gen 1991 anni
15.679 Mille.
+1.827 Mille.
13.19%
1 gen 1992 anni
14.045 Mille.
-1.634 Mille.
-10.42%
1 gen 1993 anni
17.685 Mille.
+3.64 Mille.
25.92%
1 gen 1994 anni
12.676 Mille.
-5.01 Mille.
-28.33%
1 gen 1995 anni
13.658 Mille.
+982.27
7.75%
1 gen 1996 anni
14.154 Mille.
+496.334
3.63%
1 gen 1997 anni
12.705 Mille.
-1.45 Mille.
-10.24%
1 gen 1998 anni
11.994 Mille.
-710.867
-5.6%
1 gen 1999 anni
13.222 Mille.
+1.229 Mille.
10.24%
1 gen 2000 anni
12.085 Mille.
-1.137 Mille.
-8.6%
1 gen 2001 anni
11.812 Mille.
-273.387
-2.26%
1 gen 2002 anni
13.262 Mille.
+1.45 Mille.
12.28%
1 gen 2003 anni
14.33 Mille.
+1.067 Mille.
8.05%
1 gen 2004 anni
11.897 Mille.
-2.432 Mille.
-16.97%
1 gen 2005 anni
12.292 Mille.
+394.882
3.32%
1 gen 2006 anni
13.054 Mille.
+762.263
6.2%
1 gen 2007 anni
10.433 Mille.
-2.622 Mille.
-20.08%
1 gen 2008 anni
11.388 Mille.
+955.248
9.16%
1 gen 2009 anni
11.86 Mille.
+472.2
4.15%
1 gen 2010 anni
11.305 Mille.
-555.391
-4.68%
1 gen 2011 anni
12.293 Mille.
+988.497
8.74%
1 gen 2012 anni
12.421 Mille.
+127.945
1.04%
1 gen 2013 anni
12.549 Mille.
+127.945
1.03%
Classificazione dei paesi secondo i statistiche attuali per anni


Commenti: