29
/it/
it
AIzaSyAYiBZKx7MnpbEhh9jyipgxe19OcubqV5w
April 1, 2024
53332
Other small states
OSS
false
2
1
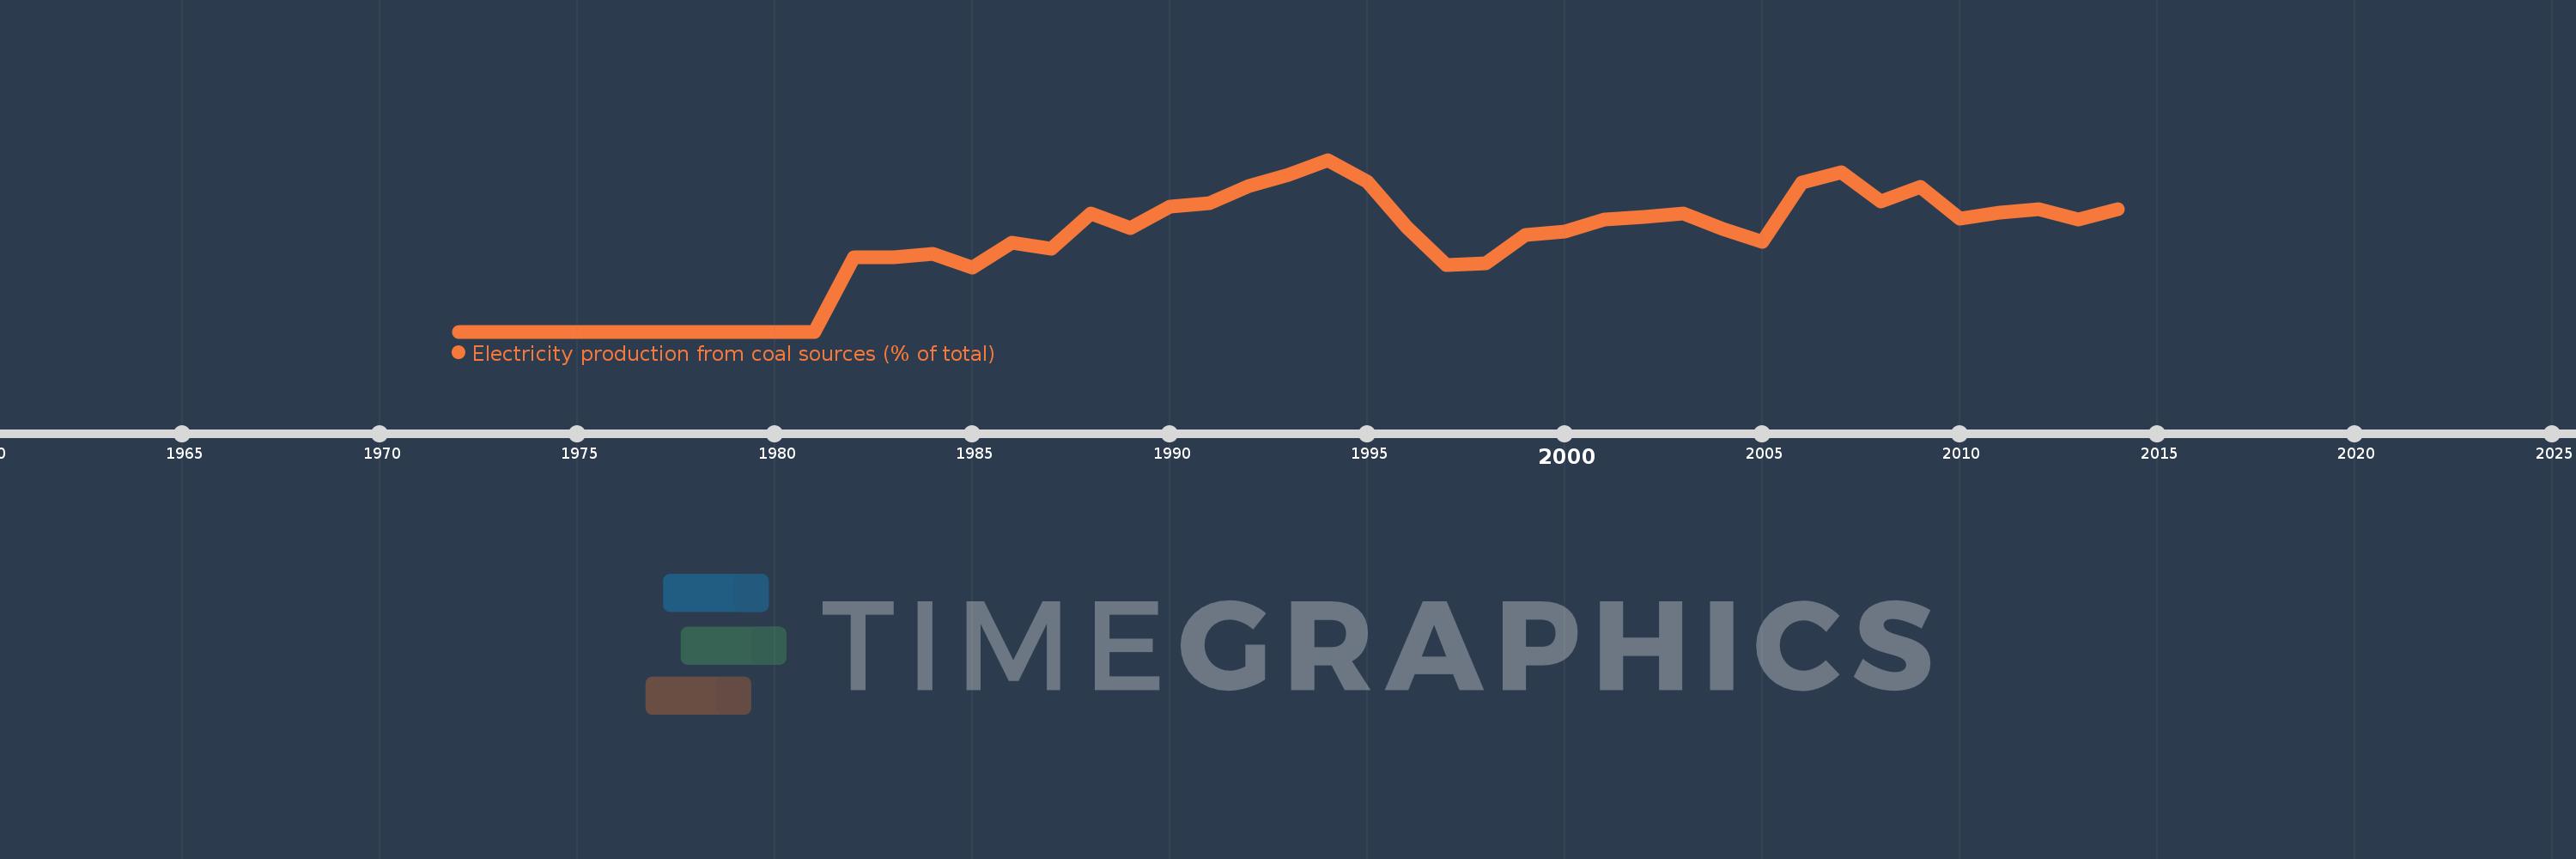
Electricity production from coal sources (% of total)
2014,2013,2012,2011,2010,2009,2008,2007,2006,2005,2004,2003,2002,2001,2000,1999,1998,1997,1996,1995,1994,1993,1992,1991,1990,1989,1988,1987,1986,1985,1984,1983,1982,1981,1980,1979,1978,1977,1976,1975,1974,1973,1972
Queste statistiche in altri paesi:
AlbaniaAlgeriaAngolaArab WorldArgentinaArmeniaAustraliaAustriaAzerbaijanBahrainBangladeshBelarusBelgiumBeninBoliviaBosnia and HerzegovinaBotswanaBrazilBrunei DarussalamBulgariaCambodiaCameroonCanadaCentral Europe and the BalticsChileChinaColombiaCongo, Dem. Rep.Congo, Rep.Costa RicaCote d'IvoireCroatiaCubaCuracaoCyprusCzech RepublicDenmarkDominican RepublicEarly-demographic dividendEast Asia & PacificEast Asia & Pacific (excluding high income)East Asia & Pacific (IDA & IBRD countries)EcuadorEgypt, Arab Rep.El SalvadorEritreaEstoniaEthiopiaEuro areaEurope & Central AsiaEurope & Central Asia (excluding high income)Europe & Central Asia (IDA & IBRD countries)European UnionFinlandFragile and conflict affected situationsFranceGabonGeorgiaGermanyGhanaGibraltarGreeceGuatemalaHaitiHeavily indebted poor countries (HIPC)High incomeHondurasHong Kong SAR, ChinaHungaryIBRD onlyIcelandIDA & IBRD totalIDA blendIDA onlyIDA totalIndiaIndonesiaIran, Islamic Rep.IraqIrelandIsraelItalyJamaicaJapanJordanKazakhstanKenyaKorea, Dem. People’s Rep.Korea, Rep.KosovoKuwaitKyrgyz RepublicLate-demographic dividendLatin America & Caribbean Latin America & Caribbean (excluding high income)Latin America & the Caribbean (IDA & IBRD countries)LatviaLeast developed countries: UN classificationLebanonLibyaLithuaniaLow & middle incomeLower middle incomeLuxembourgMacedonia, FYRMalaysiaMaltaMauritiusMexicoMiddle East & North AfricaMiddle East & North Africa (excluding high income)Middle East & North Africa (IDA & IBRD countries)Middle incomeMoldovaMongoliaMontenegroMoroccoMozambiqueMyanmarNamibiaNepalNetherlandsNew ZealandNicaraguaNigerNigeriaNorth AmericaNorwayOECD membersOmanOther small statesPakistanPanamaParaguayPeruPhilippinesPolandPortugalPost-demographic dividendPre-demographic dividendQatarRomaniaRussian FederationSaudi ArabiaSenegalSerbiaSingaporeSlovak RepublicSloveniaSmall statesSouth AfricaSouth AsiaSouth Asia (IDA & IBRD)South SudanSpainSri LankaSub-Saharan Africa Sub-Saharan Africa (excluding high income)Sub-Saharan Africa (IDA & IBRD countries)SudanSwedenSwitzerlandSyrian Arab RepublicTajikistanTanzaniaThailandTogoTrinidad and TobagoTunisiaTurkeyTurkmenistanUkraineUnited Arab EmiratesUnited KingdomUnited StatesUpper middle incomeUruguayUzbekistanVenezuela, RBVietnamWorldYemen, Rep.ZambiaZimbabwe Linea del tempo:
Questa scala temporale mostra un grafico dal 1972 anno al 2014 anno. Other small states. I dati fino ad 1971 anno non disponibili. Il numero di osservazioni attuali secondo i date: 43.
La fonte (nome):
Indicatori dello sviluppo mondiale
La fonte (organizzazione):
IEA Statistics © OECD/IEA 2014 (http://www.iea.org/stats/index.asp), subject to https://www.iea.org/t&c/termsandconditions/
Categorie:
Energy & Mining, Climate Change, Infrastructure
sono stati aggiornati
23 apr 2017 anni
Indicatori delle variazioni dei valori per anni
Minima:
0.0
1 gen 1972 anni
Massimo:
4.196
1 gen 1994 anni
Alla data di osservazione
Valore
Variazione assoluta
La variazione rispetto al valore precedente
1 gen 1972 anni
0.0
0.0
0.0%
1 gen 1982 anni
1.813
+1.813
%
1 gen 1983 anni
1.814
+0.001
0.07%
1 gen 1984 anni
1.908
+0.094
5.19%
1 gen 1985 anni
1.558
-0.35
-18.35%
1 gen 1986 anni
2.179
+0.621
39.85%
1 gen 1987 anni
2.021
-0.158
-7.23%
1 gen 1988 anni
2.875
+0.854
42.25%
1 gen 1989 anni
2.538
-0.338
-11.74%
1 gen 1990 anni
3.045
+0.507
19.99%
1 gen 1991 anni
3.141
+0.095
3.13%
1 gen 1992 anni
3.559
+0.418
13.31%
1 gen 1993 anni
3.836
+0.278
7.8%
1 gen 1994 anni
4.196
+0.36
9.39%
1 gen 1995 anni
3.668
-0.529
-12.6%
1 gen 1996 anni
2.553
-1.115
-30.39%
1 gen 1997 anni
1.617
-0.936
-36.68%
1 gen 1998 anni
1.676
+0.06
3.7%
1 gen 1999 anni
2.355
+0.679
40.48%
1 gen 2000 anni
2.435
+0.08
3.38%
1 gen 2001 anni
2.745
+0.31
12.73%
1 gen 2002 anni
2.797
+0.053
1.92%
1 gen 2003 anni
2.888
+0.09
3.23%
1 gen 2004 anni
2.502
-0.386
-13.38%
1 gen 2005 anni
2.192
-0.31
-12.39%
1 gen 2006 anni
3.646
+1.454
66.33%
1 gen 2007 anni
3.892
+0.246
6.75%
1 gen 2008 anni
3.185
-0.707
-18.16%
1 gen 2009 anni
3.543
+0.358
11.25%
1 gen 2010 anni
2.762
-0.781
-22.05%
1 gen 2011 anni
2.913
+0.151
5.46%
1 gen 2012 anni
2.991
+0.078
2.67%
1 gen 2013 anni
2.735
-0.256
-8.57%
1 gen 2014 anni
2.998
+0.263
9.62%
Classificazione dei paesi secondo i statistiche attuali per anni


Commenti: