29
/it/
it
AIzaSyAYiBZKx7MnpbEhh9jyipgxe19OcubqV5w
April 1, 2024
52696
OECD members
OED
false
2
1
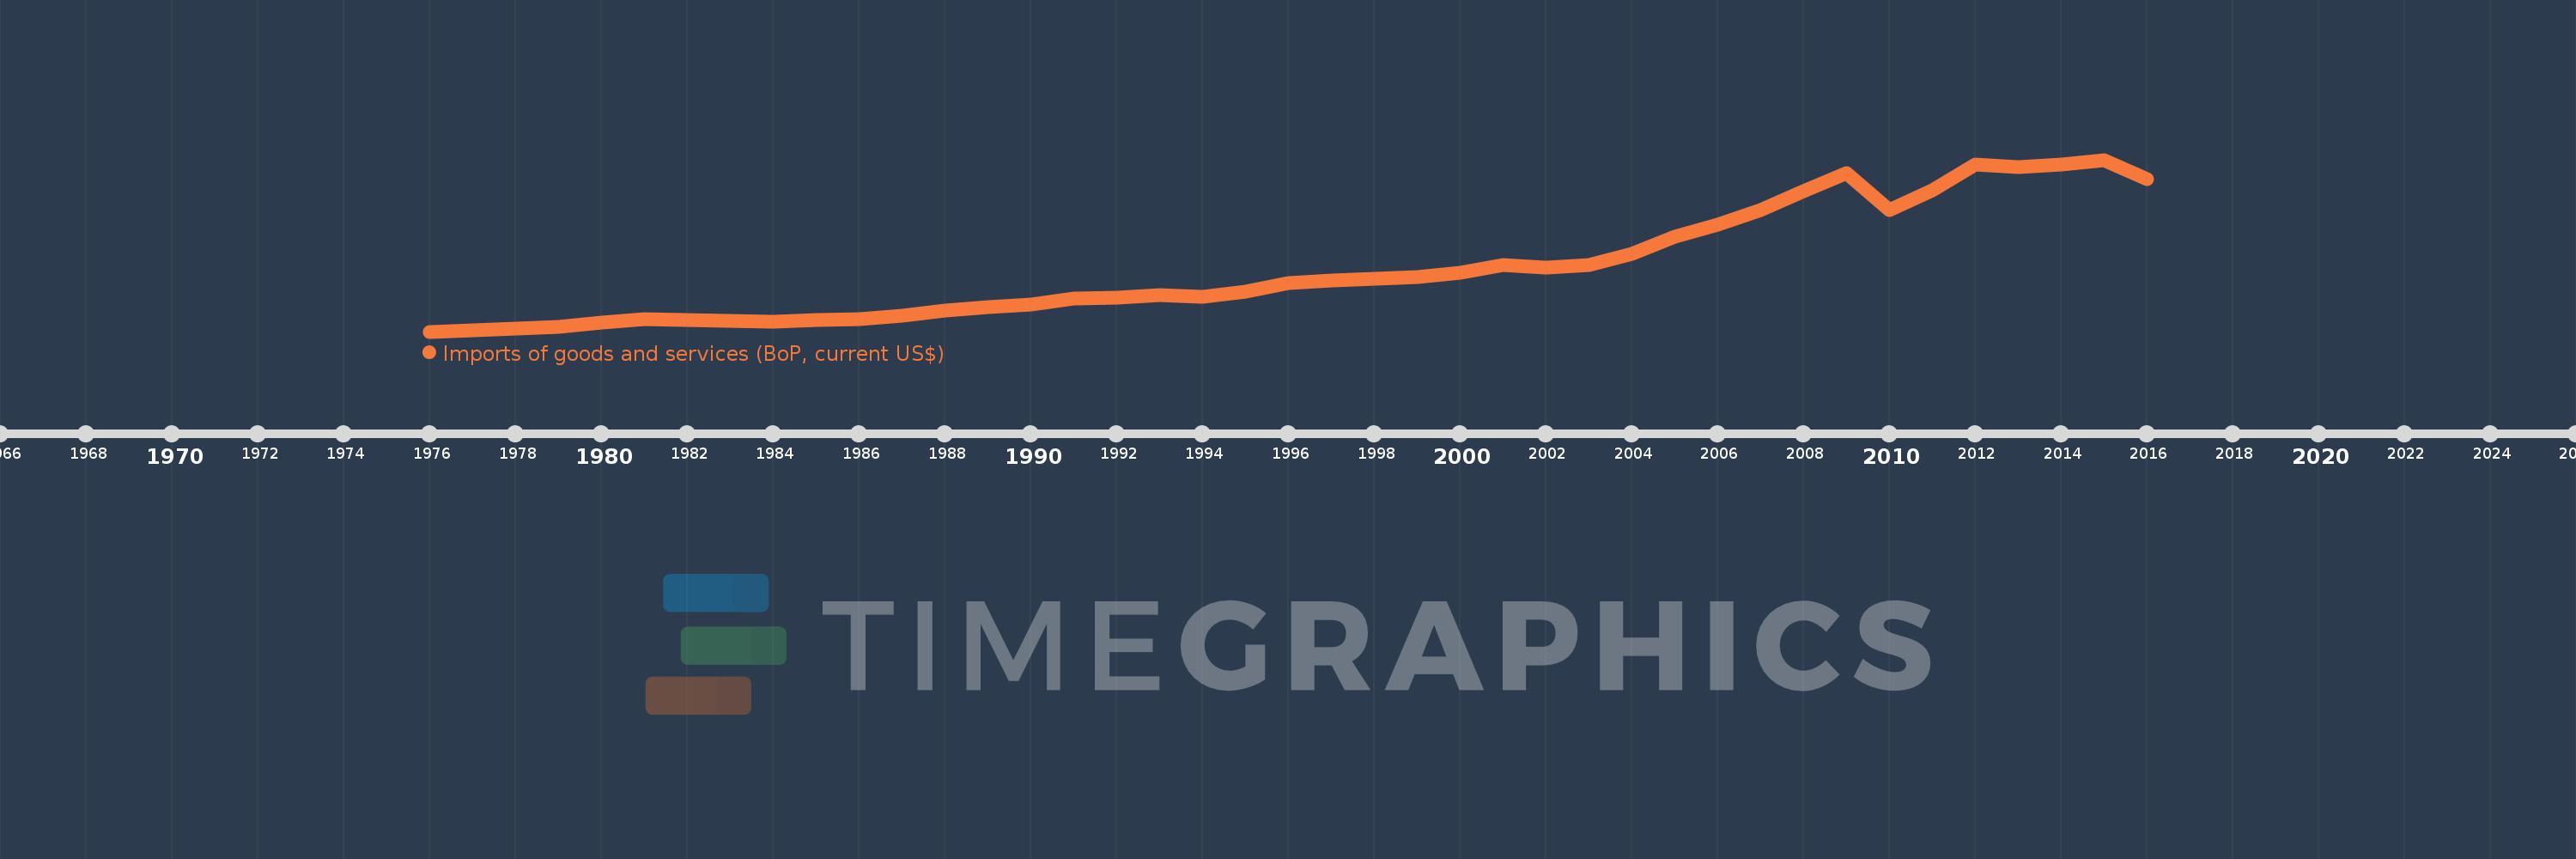
Imports of goods and services (BoP, current US$)
2016,2015,2014,2013,2012,2011,2010,2009,2008,2007,2006,2005,2004,2003,2002,2001,2000,1999,1998,1997,1996,1995,1994,1993,1992,1991,1990,1989,1988,1987,1986,1985,1984,1983,1982,1981,1980,1979,1978,1977,1976
Queste statistiche in altri paesi:
AfghanistanAlbaniaAlgeriaAngolaAntigua and BarbudaArab WorldArgentinaArmeniaArubaAustraliaAustriaAzerbaijanBahamas, TheBahrainBangladeshBarbadosBelarusBelgiumBelizeBeninBermudaBhutanBoliviaBosnia and HerzegovinaBotswanaBrazilBrunei DarussalamBulgariaBurkina FasoBurundiCabo VerdeCambodiaCameroonCanadaCaribbean small statesCentral African RepublicCentral Europe and the BalticsChadChileChinaColombiaComorosCongo, Dem. Rep.Congo, Rep.Costa RicaCote d'IvoireCroatiaCuracaoCyprusCzech RepublicDenmarkDjiboutiDominicaDominican RepublicEarly-demographic dividendEast Asia & PacificEast Asia & Pacific (excluding high income)East Asia & Pacific (IDA & IBRD countries)EcuadorEgypt, Arab Rep.El SalvadorEquatorial GuineaEritreaEstoniaEthiopiaEuro areaEurope & Central AsiaEurope & Central Asia (excluding high income)Europe & Central Asia (IDA & IBRD countries)European UnionFaroe IslandsFijiFinlandFragile and conflict affected situationsFranceFrench PolynesiaGabonGambia, TheGeorgiaGermanyGhanaGreeceGrenadaGuatemalaGuineaGuinea-BissauGuyanaHaitiHeavily indebted poor countries (HIPC)High incomeHondurasHong Kong SAR, ChinaHungaryIBRD onlyIcelandIDA & IBRD totalIDA blendIDA onlyIDA totalIndiaIndonesiaIran, Islamic Rep.IraqIrelandIsraelItalyJamaicaJapanJordanKazakhstanKenyaKiribatiKorea, Rep.KosovoKuwaitKyrgyz RepublicLao PDRLate-demographic dividendLatin America & Caribbean Latin America & Caribbean (excluding high income)Latin America & the Caribbean (IDA & IBRD countries)LatviaLeast developed countries: UN classificationLebanonLesothoLiberiaLibyaLithuaniaLow & middle incomeLow incomeLower middle incomeLuxembourgMacao SAR, ChinaMacedonia, FYRMadagascarMalawiMalaysiaMaldivesMaliMaltaMarshall IslandsMauritaniaMauritiusMexicoMicronesia, Fed. Sts.Middle East & North Africa (excluding high income)Middle East & North Africa (IDA & IBRD countries)Middle incomeMoldovaMongoliaMontenegroMoroccoMozambiqueMyanmarNamibiaNepalNetherlandsNew CaledoniaNicaraguaNigerNigeriaNorth AmericaNorwayOECD membersOmanOther small statesPacific island small statesPakistanPalauPanamaPapua New GuineaParaguayPeruPhilippinesPolandPortugalPost-demographic dividendPre-demographic dividendQatarRomaniaRussian FederationRwandaSamoaSao Tome and PrincipeSaudi ArabiaSenegalSerbiaSeychellesSierra LeoneSingaporeSint Maarten (Dutch part)Slovak RepublicSloveniaSmall statesSolomon IslandsSouth AfricaSouth AsiaSouth Asia (IDA & IBRD)South SudanSpainSri LankaSt. Kitts and NevisSt. LuciaSt. Vincent and the GrenadinesSub-Saharan Africa Sub-Saharan Africa (excluding high income)Sub-Saharan Africa (IDA & IBRD countries)SudanSurinameSwazilandSwedenSwitzerlandSyrian Arab RepublicTajikistanTanzaniaThailandTimor-LesteTogoTongaTrinidad and TobagoTunisiaTurkeyTuvaluUgandaUkraineUnited KingdomUnited StatesUpper middle incomeUruguayVanuatuVenezuela, RBVietnamWest Bank and GazaWorldYemen, Rep.ZambiaZimbabwe Linea del tempo:
Questa scala temporale mostra un grafico dal 1976 anno al 2016 anno. OECD members. I dati fino ad 1975 anno non disponibili. Il numero di osservazioni attuali secondo i date: 41.
La fonte (nome):
Indicatori dello sviluppo mondiale
La fonte (organizzazione):
International Monetary Fund, Balance of Payments Statistics Yearbook and data files.
Categorie:
Economy & Growth, Trade
sono stati aggiornati
23 apr 2017 anni
Indicatori delle variazioni dei valori per anni
Minima:
759.417 Mlrd
1 gen 1976 anni
Massimo:
14.113 Trln
1 gen 2015 anni
Alla data di osservazione
Valore
Variazione assoluta
La variazione rispetto al valore precedente
1 gen 1976 anni
759.417 Mlrd
+759.417 Mlrd
0.0%
1 gen 1977 anni
867.857 Mlrd
+108.44 Mlrd
14.28%
1 gen 1978 anni
984.856 Mlrd
+116.998 Mlrd
13.48%
1 gen 1979 anni
1.143 Trln
+157.653 Mlrd
16.01%
1 gen 1980 anni
1.447 Trln
+304.733 Mlrd
26.67%
1 gen 1981 anni
1.723 Trln
+276.25 Mlrd
19.09%
1 gen 1982 anni
1.671 Trln
-52.539 Mlrd
-3.05%
1 gen 1983 anni
1.569 Trln
-102.346 Mlrd
-6.13%
1 gen 1984 anni
1.551 Trln
-17.725 Mlrd
-1.13%
1 gen 1985 anni
1.675 Trln
+124.489 Mlrd
8.03%
1 gen 1986 anni
1.737 Trln
+61.396 Mlrd
3.66%
1 gen 1987 anni
2.002 Trln
+265.344 Mlrd
15.28%
1 gen 1988 anni
2.368 Trln
+366.388 Mlrd
18.3%
1 gen 1989 anni
2.67 Trln
+301.17 Mlrd
12.72%
1 gen 1990 anni
2.876 Trln
+206.571 Mlrd
7.74%
1 gen 1991 anni
3.342 Trln
+465.766 Mlrd
16.19%
1 gen 1992 anni
3.394 Trln
+51.681 Mlrd
1.55%
1 gen 1993 anni
3.624 Trln
+230.503 Mlrd
6.79%
1 gen 1994 anni
3.457 Trln
-167.435 Mlrd
-4.62%
1 gen 1995 anni
3.844 Trln
+387.705 Mlrd
11.22%
1 gen 1996 anni
4.522 Trln
+677.941 Mlrd
17.63%
1 gen 1997 anni
4.751 Trln
+228.129 Mlrd
5.04%
1 gen 1998 anni
4.888 Trln
+137.407 Mlrd
2.89%
1 gen 1999 anni
5.016 Trln
+128.35 Mlrd
2.63%
1 gen 2000 anni
5.347 Trln
+330.819 Mlrd
6.59%
1 gen 2001 anni
5.94 Trln
+592.792 Mlrd
11.09%
1 gen 2002 anni
5.722 Trln
-217.467 Mlrd
-3.66%
1 gen 2003 anni
5.902 Trln
+179.458 Mlrd
3.14%
1 gen 2004 anni
6.777 Trln
+874.728 Mlrd
14.82%
1 gen 2005 anni
8.107 Trln
+1.33 Trln
19.63%
1 gen 2006 anni
9.051 Trln
+944.131 Mlrd
11.65%
1 gen 2007 anni
10.24 Trln
+1.19 Trln
13.14%
1 gen 2008 anni
11.643 Trln
+1.403 Trln
13.7%
1 gen 2009 anni
13.094 Trln
+1.45 Trln
12.45%
1 gen 2010 anni
10.183 Trln
-2.911 Trln
-22.23%
1 gen 2011 anni
11.759 Trln
+1.576 Trln
15.48%
1 gen 2012 anni
13.765 Trln
+2.006 Trln
17.06%
1 gen 2013 anni
13.547 Trln
-217.938 Mlrd
-1.58%
1 gen 2014 anni
13.76 Trln
+213.401 Mlrd
1.58%
1 gen 2015 anni
14.113 Trln
+352.647 Mlrd
2.56%
1 gen 2016 anni
12.602 Trln
-1.511 Trln
-10.71%
Classificazione dei paesi secondo i statistiche attuali per anni


Commenti: