29
/it/
it
AIzaSyAYiBZKx7MnpbEhh9jyipgxe19OcubqV5w
April 1, 2024
52512
OECD members
OED
false
2
1
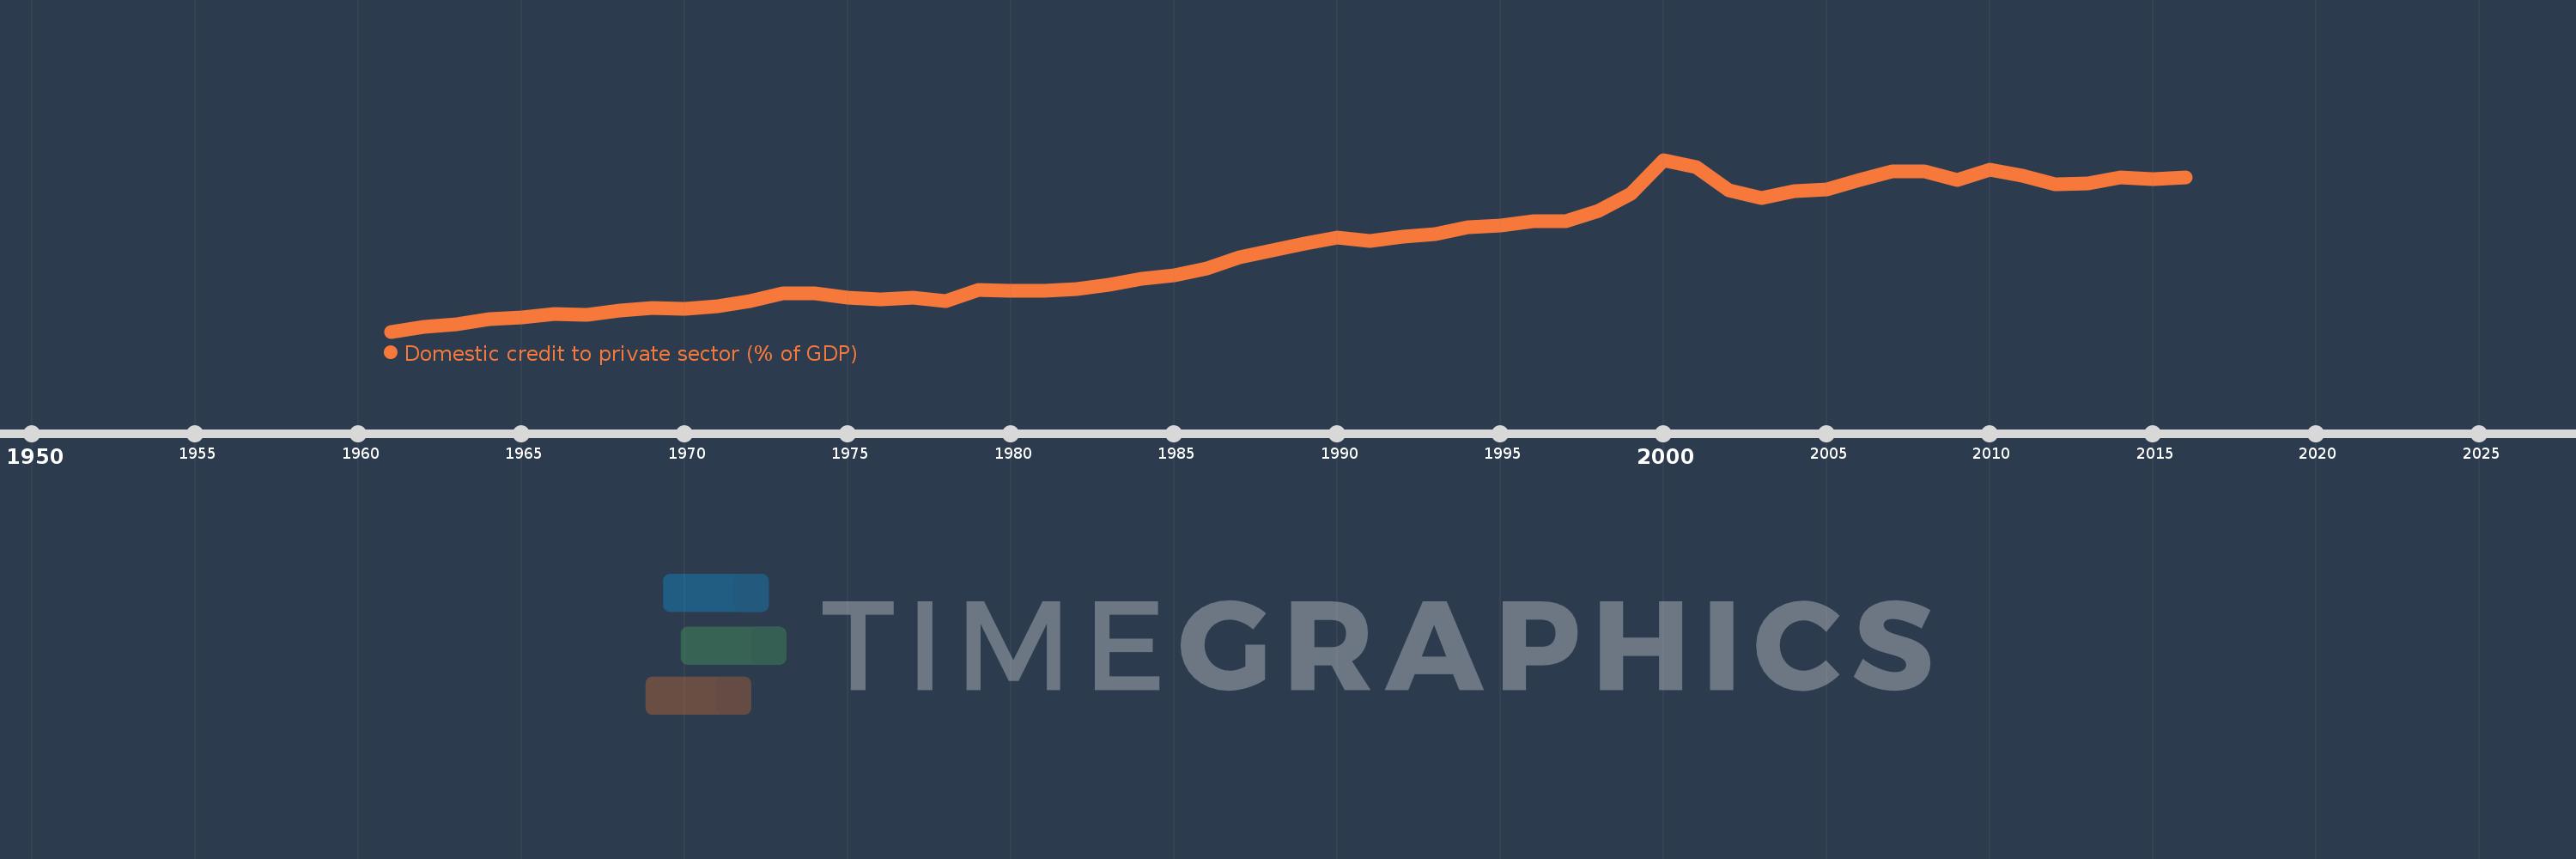
Domestic credit to private sector (% of GDP)
2016,2015,2014,2013,2012,2011,2010,2009,2008,2007,2006,2005,2004,2003,2002,2001,2000,1999,1998,1997,1996,1995,1994,1993,1992,1991,1990,1989,1988,1987,1986,1985,1984,1983,1982,1981,1980,1979,1978,1977,1976,1975,1974,1973,1972,1971,1970,1969,1968,1967,1966,1965,1964,1963,1962,1961
Queste statistiche in altri paesi:
AfghanistanAlbaniaAlgeriaAngolaAntigua and BarbudaArab WorldArgentinaArmeniaArubaAustraliaAustriaAzerbaijanBahamas, TheBahrainBangladeshBarbadosBelarusBelgiumBelizeBeninBhutanBoliviaBosnia and HerzegovinaBotswanaBrazilBrunei DarussalamBulgariaBurkina FasoBurundiCabo VerdeCambodiaCameroonCanadaCaribbean small statesCentral African RepublicCentral Europe and the BalticsChadChileChinaColombiaComorosCongo, Dem. Rep.Congo, Rep.Costa RicaCote d'IvoireCroatiaCyprusCzech RepublicDenmarkDjiboutiDominicaDominican RepublicEarly-demographic dividendEast Asia & PacificEast Asia & Pacific (excluding high income)East Asia & Pacific (IDA & IBRD countries)EcuadorEgypt, Arab Rep.El SalvadorEquatorial GuineaEritreaEstoniaEthiopiaEuro areaEurope & Central AsiaEurope & Central Asia (excluding high income)Europe & Central Asia (IDA & IBRD countries)European UnionFijiFinlandFragile and conflict affected situationsFranceGabonGambia, TheGeorgiaGermanyGhanaGreeceGrenadaGuatemalaGuineaGuinea-BissauGuyanaHaitiHeavily indebted poor countries (HIPC)High incomeHondurasHong Kong SAR, ChinaHungaryIBRD onlyIcelandIDA & IBRD totalIDA blendIDA onlyIDA totalIndiaIndonesiaIran, Islamic Rep.IraqIrelandIsraelItalyJamaicaJapanJordanKazakhstanKenyaKorea, Rep.KosovoKuwaitKyrgyz RepublicLao PDRLate-demographic dividendLatin America & Caribbean Latin America & Caribbean (excluding high income)Latin America & the Caribbean (IDA & IBRD countries)LatviaLeast developed countries: UN classificationLebanonLesothoLiberiaLibyaLithuaniaLow & middle incomeLow incomeLower middle incomeLuxembourgMacao SAR, ChinaMacedonia, FYRMadagascarMalawiMalaysiaMaldivesMaliMaltaMauritaniaMauritiusMexicoMicronesia, Fed. Sts.Middle East & North AfricaMiddle East & North Africa (excluding high income)Middle East & North Africa (IDA & IBRD countries)Middle incomeMoldovaMongoliaMontenegroMoroccoMozambiqueMyanmarNamibiaNepalNetherlandsNew ZealandNicaraguaNigerNigeriaNorth AmericaNorwayOECD membersOmanOther small statesPacific island small statesPakistanPanamaPapua New GuineaParaguayPeruPhilippinesPolandPortugalPost-demographic dividendPre-demographic dividendQatarRomaniaRussian FederationRwandaSamoaSao Tome and PrincipeSaudi ArabiaSenegalSerbiaSeychellesSierra LeoneSingaporeSlovak RepublicSloveniaSmall statesSolomon IslandsSouth AfricaSouth AsiaSouth Asia (IDA & IBRD)South SudanSpainSri LankaSt. Kitts and NevisSt. LuciaSt. Vincent and the GrenadinesSub-Saharan Africa Sub-Saharan Africa (excluding high income)Sub-Saharan Africa (IDA & IBRD countries)SudanSurinameSwazilandSwedenSwitzerlandSyrian Arab RepublicTajikistanTanzaniaThailandTimor-LesteTogoTongaTrinidad and TobagoTunisiaTurkeyUgandaUkraineUnited Arab EmiratesUnited KingdomUnited StatesUpper middle incomeUruguayVanuatuVenezuela, RBVietnamWest Bank and GazaWorldYemen, Rep.ZambiaZimbabwe Linea del tempo:
Questa scala temporale mostra un grafico dal 1961 anno al 2016 anno. OECD members. I dati fino ad 1960 anno non disponibili. Il numero di osservazioni attuali secondo i date: 56.
La fonte (nome):
Indicatori dello sviluppo mondiale
La fonte (organizzazione):
International Monetary Fund, International Financial Statistics and data files, and World Bank and OECD GDP estimates.
Categorie:
Financial Sector, Private Sector
sono stati aggiornati
23 apr 2017 anni
Indicatori delle variazioni dei valori per anni
Minima:
52.986
1 gen 1961 anni
Massimo:
156.508
1 gen 2000 anni
Alla data di osservazione
Valore
Variazione assoluta
La variazione rispetto al valore precedente
1 gen 1961 anni
52.986
+52.986
0.0%
1 gen 1962 anni
55.704
+2.718
5.13%
1 gen 1963 anni
57.386
+1.682
3.02%
1 gen 1964 anni
60.274
+2.888
5.03%
1 gen 1965 anni
61.545
+1.271
2.11%
1 gen 1966 anni
63.793
+2.248
3.65%
1 gen 1967 anni
63.113
-0.68
-1.07%
1 gen 1968 anni
65.543
+2.43
3.85%
1 gen 1969 anni
67.098
+1.555
2.37%
1 gen 1970 anni
66.779
-0.318
-0.47%
1 gen 1971 anni
68.476
+1.697
2.54%
1 gen 1972 anni
71.485
+3.009
4.39%
1 gen 1973 anni
76.243
+4.758
6.66%
1 gen 1974 anni
75.987
-0.256
-0.34%
1 gen 1975 anni
73.534
-2.453
-3.23%
1 gen 1976 anni
72.488
-1.046
-1.42%
1 gen 1977 anni
73.275
+0.787
1.09%
1 gen 1978 anni
71.113
-2.162
-2.95%
1 gen 1979 anni
78.023
+6.91
9.72%
1 gen 1980 anni
77.397
-0.626
-0.8%
1 gen 1981 anni
77.486
+0.089
0.12%
1 gen 1982 anni
78.458
+0.972
1.25%
1 gen 1983 anni
81.335
+2.877
3.67%
1 gen 1984 anni
84.979
+3.644
4.48%
1 gen 1985 anni
86.936
+1.957
2.3%
1 gen 1986 anni
91.046
+4.11
4.73%
1 gen 1987 anni
97.595
+6.549
7.19%
1 gen 1988 anni
101.919
+4.324
4.43%
1 gen 1989 anni
106.101
+4.182
4.1%
1 gen 1990 anni
109.645
+3.544
3.34%
1 gen 1991 anni
107.806
-1.839
-1.68%
1 gen 1992 anni
110.394
+2.588
2.4%
1 gen 1993 anni
111.673
+1.278
1.16%
1 gen 1994 anni
115.835
+4.162
3.73%
1 gen 1995 anni
116.698
+0.863
0.75%
1 gen 1996 anni
119.358
+2.66
2.28%
1 gen 1997 anni
119.757
+0.399
0.33%
1 gen 1998 anni
125.75
+5.993
5.0%
1 gen 1999 anni
135.939
+10.189
8.1%
1 gen 2000 anni
156.508
+20.569
15.13%
1 gen 2001 anni
151.861
-4.647
-2.97%
1 gen 2002 anni
138.35
-13.511
-8.9%
1 gen 2003 anni
133.515
-4.836
-3.5%
1 gen 2004 anni
137.482
+3.967
2.97%
1 gen 2005 anni
138.662
+1.18
0.86%
1 gen 2006 anni
144.222
+5.56
4.01%
1 gen 2007 anni
149.507
+5.285
3.66%
1 gen 2008 anni
149.638
+0.13
0.09%
1 gen 2009 anni
144.457
-5.18
-3.46%
1 gen 2010 anni
150.629
+6.171
4.27%
1 gen 2011 anni
146.815
-3.814
-2.53%
1 gen 2012 anni
141.613
-5.201
-3.54%
1 gen 2013 anni
142.515
+0.902
0.64%
1 gen 2014 anni
145.758
+3.243
2.28%
1 gen 2015 anni
145.027
-0.732
-0.5%
1 gen 2016 anni
146.12
+1.093
0.75%
Classificazione dei paesi secondo i statistiche attuali per anni


Commenti: