29
/it/
it
AIzaSyAYiBZKx7MnpbEhh9jyipgxe19OcubqV5w
April 1, 2024
52266
North America
NAC
false
2
1
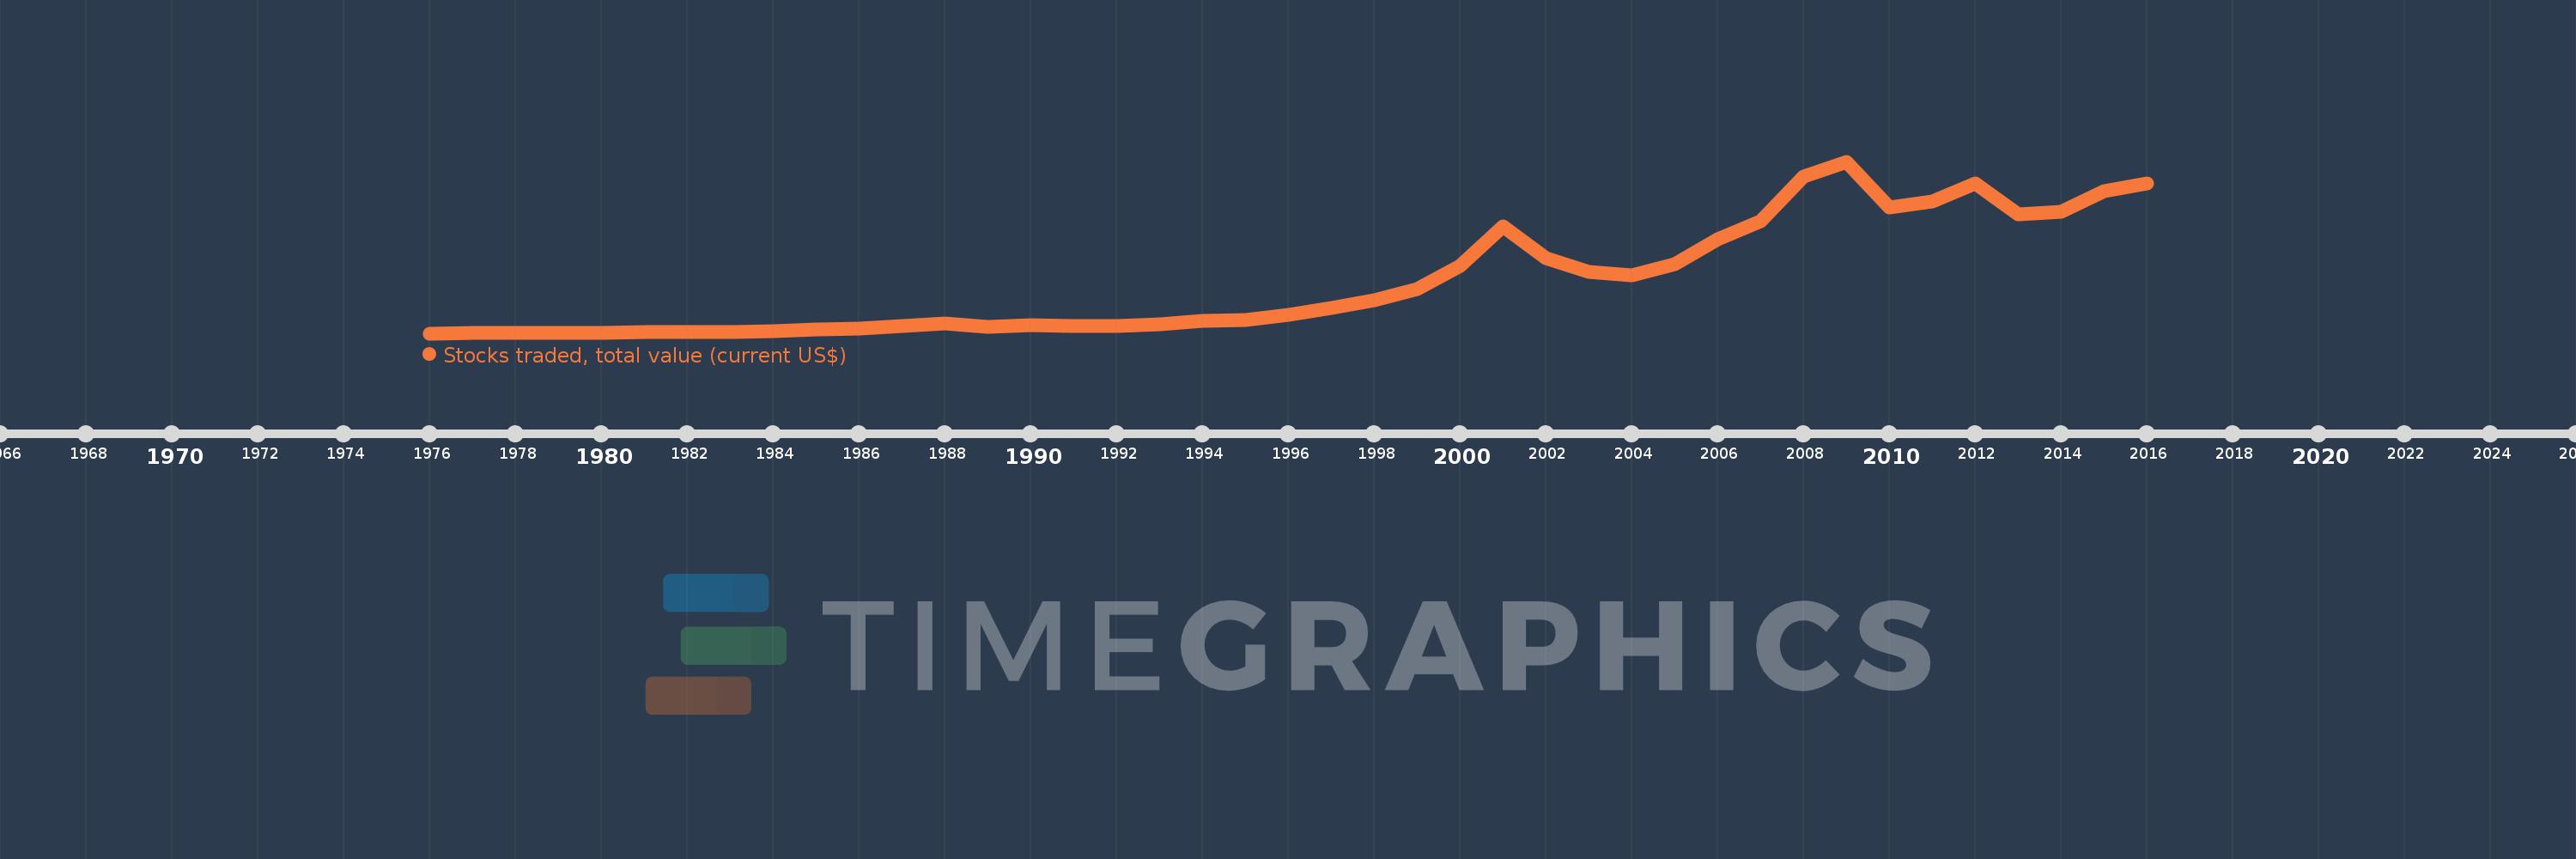
Stocks traded, total value (current US$)
2016,2015,2014,2013,2012,2011,2010,2009,2008,2007,2006,2005,2004,2003,2002,2001,2000,1999,1998,1997,1996,1995,1994,1993,1992,1991,1990,1989,1988,1987,1986,1985,1984,1983,1982,1981,1980,1979,1978,1977,1976
Queste statistiche in altri paesi:
Linea del tempo:
Questa scala temporale mostra un grafico dal 1976 anno al 2016 anno. North America. I dati fino ad 1975 anno non disponibili. Il numero di osservazioni attuali secondo i date: 41.
La fonte (nome):
Indicatori dello sviluppo mondiale
La fonte (organizzazione):
World Federation of Exchanges database.
Categorie:
Financial Sector
sono stati aggiornati
23 apr 2017 anni
Indicatori delle variazioni dei valori per anni
Minima:
142.49 Mlrd
1 gen 1976 anni
Massimo:
48.749 Trln
1 gen 2009 anni
Alla data di osservazione
Valore
Variazione assoluta
La variazione rispetto al valore precedente
1 gen 1976 anni
142.49 Mlrd
+142.49 Mlrd
0.0%
1 gen 1977 anni
179.69 Mlrd
+37.2 Mlrd
26.11%
1 gen 1978 anni
172.541 Mlrd
-7.149 Mlrd
-3.98%
1 gen 1979 anni
236.003 Mlrd
+63.462 Mlrd
36.78%
1 gen 1980 anni
289.928 Mlrd
+53.925 Mlrd
22.85%
1 gen 1981 anni
436.972 Mlrd
+147.044 Mlrd
50.72%
1 gen 1982 anni
439.447 Mlrd
+2.475 Mlrd
0.57%
1 gen 1983 anni
524.612 Mlrd
+85.165 Mlrd
19.38%
1 gen 1984 anni
825.292 Mlrd
+300.68 Mlrd
57.31%
1 gen 1985 anni
1.134 Trln
+308.437 Mlrd
37.37%
1 gen 1986 anni
1.508 Trln
+374.045 Mlrd
32.99%
1 gen 1987 anni
2.239 Trln
+731.13 Mlrd
48.49%
1 gen 1988 anni
2.97 Trln
+731.315 Mlrd
32.66%
1 gen 1989 anni
2.034 Trln
-936.34 Mlrd
-31.52%
1 gen 1990 anni
2.431 Trln
+397.073 Mlrd
19.52%
1 gen 1991 anni
2.1 Trln
-330.73 Mlrd
-13.6%
1 gen 1992 anni
2.213 Trln
+112.956 Mlrd
5.38%
1 gen 1993 anni
2.606 Trln
+392.977 Mlrd
17.76%
1 gen 1994 anni
3.568 Trln
+961.616 Mlrd
36.9%
1 gen 1995 anni
3.805 Trln
+237.115 Mlrd
6.65%
1 gen 1996 anni
5.362 Trln
+1.557 Trln
40.93%
1 gen 1997 anni
7.231 Trln
+1.868 Trln
34.85%
1 gen 1998 anni
9.604 Trln
+2.373 Trln
32.82%
1 gen 1999 anni
12.662 Trln
+3.058 Trln
31.85%
1 gen 2000 anni
19.209 Trln
+6.547 Trln
51.7%
1 gen 2001 anni
30.411 Trln
+11.202 Trln
58.32%
1 gen 2002 anni
21.33 Trln
-9.081 Trln
-29.86%
1 gen 2003 anni
17.501 Trln
-3.828 Trln
-17.95%
1 gen 2004 anni
16.552 Trln
-949.733 Mlrd
-5.43%
1 gen 2005 anni
19.81 Trln
+3.258 Trln
19.68%
1 gen 2006 anni
26.724 Trln
+6.915 Trln
34.91%
1 gen 2007 anni
31.819 Trln
+5.095 Trln
19.06%
1 gen 2008 anni
44.598 Trln
+12.779 Trln
40.16%
1 gen 2009 anni
48.749 Trln
+4.151 Trln
9.31%
1 gen 2010 anni
35.639 Trln
-13.109 Trln
-26.89%
1 gen 2011 anni
37.43 Trln
+1.791 Trln
5.03%
1 gen 2012 anni
42.52 Trln
+5.089 Trln
13.6%
1 gen 2013 anni
33.698 Trln
-8.822 Trln
-20.75%
1 gen 2014 anni
34.571 Trln
+873.24 Mlrd
2.59%
1 gen 2015 anni
40.321 Trln
+5.75 Trln
16.63%
1 gen 2016 anni
42.495 Trln
+2.174 Trln
5.39%
Classificazione dei paesi secondo i statistiche attuali per anni


Commenti: