29
/it/
it
AIzaSyAYiBZKx7MnpbEhh9jyipgxe19OcubqV5w
April 1, 2024
51478
Middle income
MIC
false
2
1
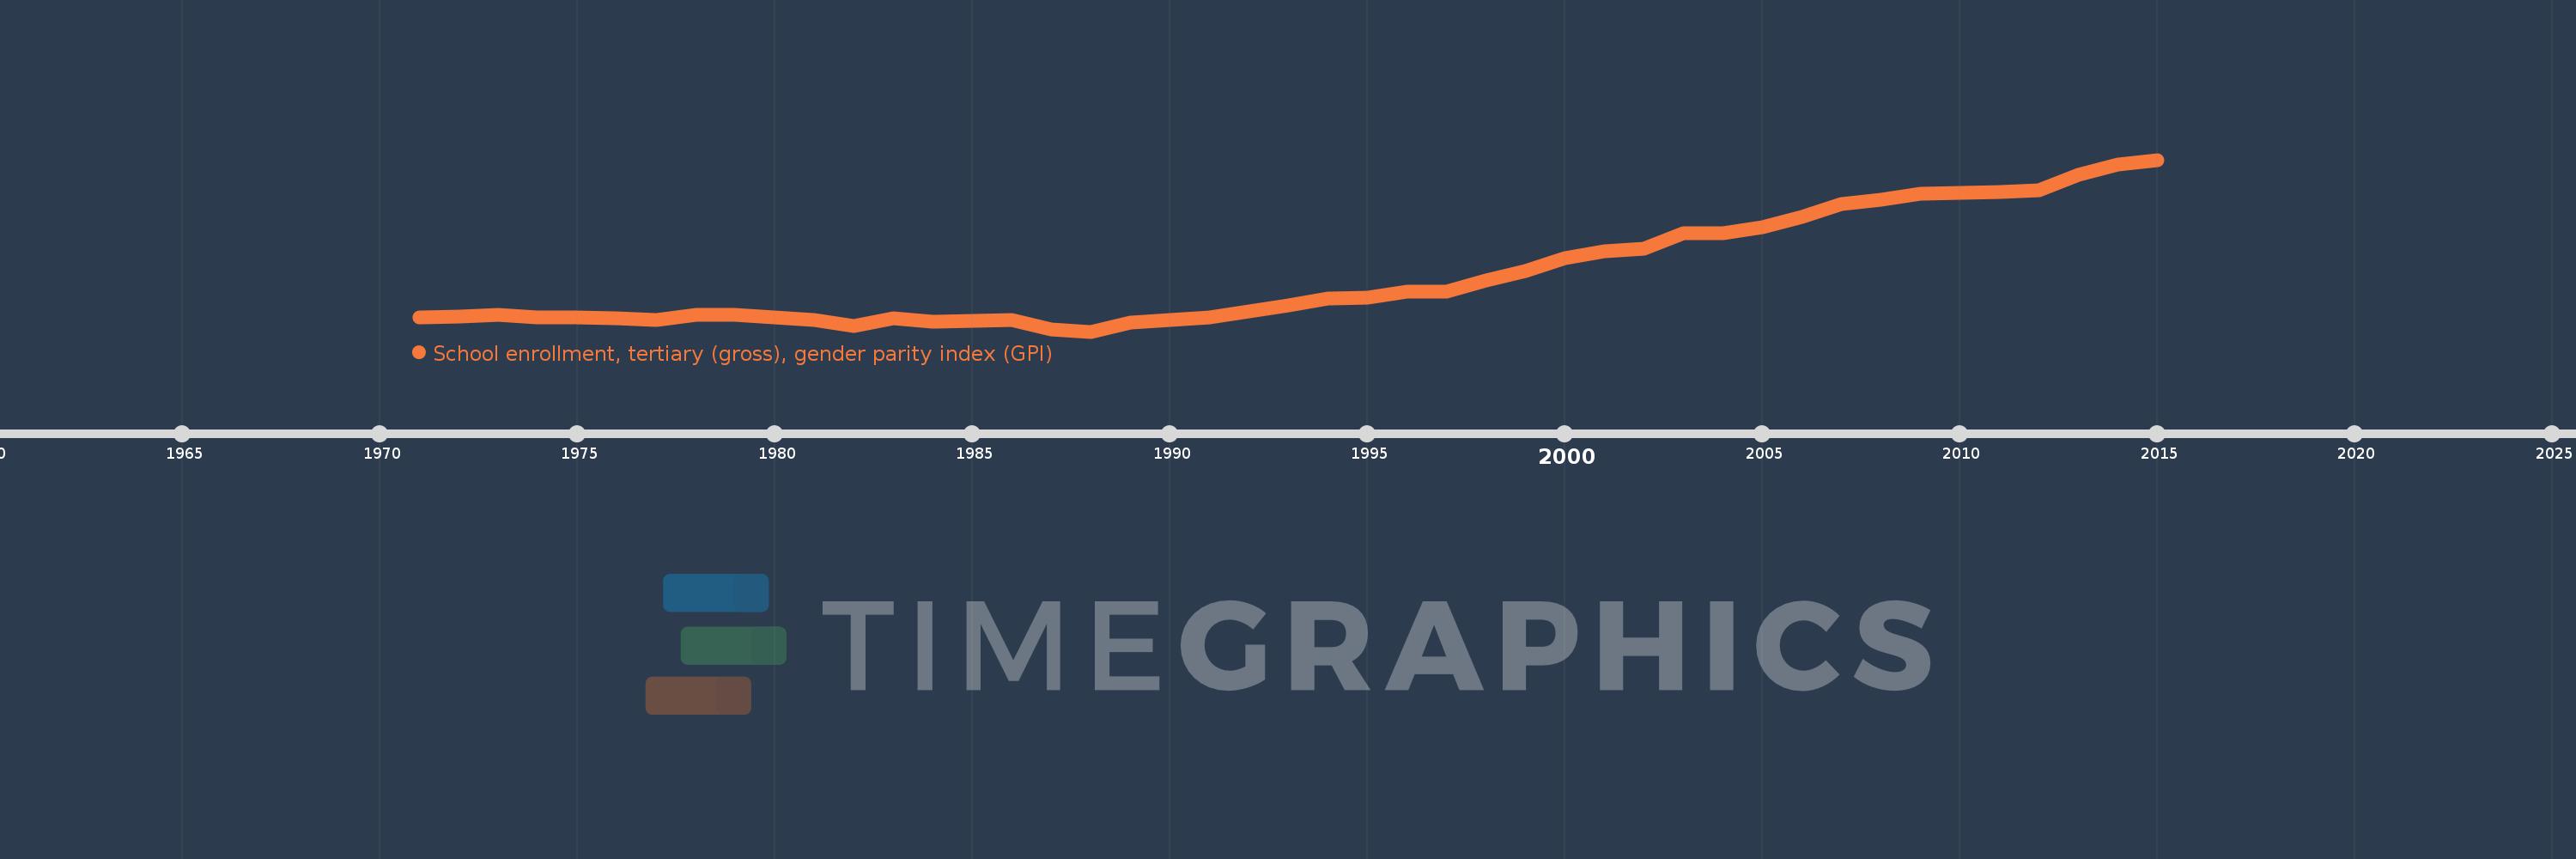
School enrollment, tertiary (gross), gender parity index (GPI)
2015,2014,2013,2012,2011,2010,2009,2008,2007,2006,2005,2004,2003,2002,2001,2000,1999,1998,1997,1996,1995,1994,1993,1992,1991,1990,1989,1988,1987,1986,1985,1984,1983,1982,1981,1980,1979,1978,1977,1976,1975,1974,1973,1972,1971
Queste statistiche in altri paesi:
AfghanistanAlbaniaAlgeriaAngolaAntigua and BarbudaArab WorldArgentinaArmeniaArubaAustraliaAustriaAzerbaijanBahamas, TheBahrainBangladeshBarbadosBelarusBelgiumBelizeBeninBermudaBhutanBoliviaBosnia and HerzegovinaBotswanaBrazilBrunei DarussalamBulgariaBurkina FasoBurundiCabo VerdeCambodiaCameroonCanadaCaribbean small statesCentral African RepublicCentral Europe and the BalticsChadChileChinaColombiaComorosCongo, Dem. Rep.Congo, Rep.Costa RicaCote d'IvoireCroatiaCubaCuracaoCyprusCzech RepublicDenmarkDjiboutiDominicaDominican RepublicEarly-demographic dividendEast Asia & PacificEast Asia & Pacific (excluding high income)East Asia & Pacific (IDA & IBRD countries)EcuadorEgypt, Arab Rep.El SalvadorEquatorial GuineaEritreaEstoniaEthiopiaEuro areaEurope & Central AsiaEurope & Central Asia (excluding high income)Europe & Central Asia (IDA & IBRD countries)European UnionFijiFinlandFragile and conflict affected situationsFranceGabonGambia, TheGeorgiaGermanyGhanaGreeceGrenadaGuatemalaGuineaGuinea-BissauGuyanaHaitiHeavily indebted poor countries (HIPC)High incomeHondurasHong Kong SAR, ChinaHungaryIBRD onlyIcelandIDA & IBRD totalIDA blendIDA onlyIDA totalIndiaIndonesiaIran, Islamic Rep.IraqIrelandIsraelItalyJamaicaJapanJordanKazakhstanKenyaKorea, Dem. People’s Rep.Korea, Rep.KuwaitKyrgyz RepublicLao PDRLate-demographic dividendLatin America & Caribbean Latin America & Caribbean (excluding high income)Latin America & the Caribbean (IDA & IBRD countries)LatviaLeast developed countries: UN classificationLebanonLesothoLiberiaLibyaLiechtensteinLithuaniaLow & middle incomeLow incomeLower middle incomeLuxembourgMacao SAR, ChinaMacedonia, FYRMadagascarMalawiMaldivesMaliMaltaMarshall IslandsMauritaniaMauritiusMexicoMicronesia, Fed. Sts.Middle East & North AfricaMiddle East & North Africa (excluding high income)Middle East & North Africa (IDA & IBRD countries)Middle incomeMoldovaMongoliaMontenegroMoroccoMozambiqueMyanmarNamibiaNepalNetherlandsNew ZealandNicaraguaNigerNigeriaNorth AmericaNorwayOECD membersOmanOther small statesPacific island small statesPakistanPalauPanamaPapua New GuineaParaguayPeruPhilippinesPolandPortugalPost-demographic dividendPre-demographic dividendPuerto RicoQatarRomaniaRussian FederationRwandaSamoaSan MarinoSao Tome and PrincipeSaudi ArabiaSenegalSerbiaSeychellesSierra LeoneSingaporeSlovak RepublicSloveniaSmall statesSomaliaSouth AfricaSouth AsiaSouth Asia (IDA & IBRD)SpainSri LankaSt. Kitts and NevisSt. LuciaSt. Vincent and the GrenadinesSub-Saharan Africa Sub-Saharan Africa (excluding high income)Sub-Saharan Africa (IDA & IBRD countries)SudanSurinameSwazilandSwedenSwitzerlandSyrian Arab RepublicTajikistanTanzaniaThailandTimor-LesteTogoTongaTrinidad and TobagoTunisiaTurkeyTurkmenistanUgandaUkraineUnited Arab EmiratesUnited KingdomUnited StatesUpper middle incomeUruguayUzbekistanVanuatuVenezuela, RBVietnamWest Bank and GazaWorldYemen, Rep.ZambiaZimbabwe Linea del tempo:
Questa scala temporale mostra un grafico dal 1971 anno al 2015 anno. Middle income. I dati fino ad 1970 anno non disponibili. Il numero di osservazioni attuali secondo i date: 45.
La fonte (nome):
Indicatori dello sviluppo mondiale
La fonte (organizzazione):
United Nations Educational, Scientific, and Cultural Organization (UNESCO) Institute for Statistics.
Categorie:
Education, Gender, Social Development
sono stati aggiornati
23 apr 2017 anni
Indicatori delle variazioni dei valori per anni
Minima:
0.778
1 gen 1988 anni
Massimo:
1.095
1 gen 2015 anni
Alla data di osservazione
Valore
Variazione assoluta
La variazione rispetto al valore precedente
1 gen 1971 anni
0.804
+0.804
0.0%
1 gen 1972 anni
0.805
+0.001
0.06%
1 gen 1973 anni
0.809
+0.004
0.5%
1 gen 1974 anni
0.804
-0.005
-0.6%
1 gen 1975 anni
0.804
-0.001
-0.08%
1 gen 1976 anni
0.802
-0.002
-0.2%
1 gen 1977 anni
0.799
-0.003
-0.38%
1 gen 1978 anni
0.809
+0.01
1.22%
1 gen 1979 anni
0.809
+0.0
0.01%
1 gen 1980 anni
0.804
-0.005
-0.59%
1 gen 1981 anni
0.8
-0.004
-0.47%
1 gen 1982 anni
0.788
-0.012
-1.54%
1 gen 1983 anni
0.803
+0.015
1.89%
1 gen 1984 anni
0.797
-0.006
-0.73%
1 gen 1985 anni
0.798
+0.001
0.1%
1 gen 1986 anni
0.799
+0.001
0.13%
1 gen 1987 anni
0.782
-0.017
-2.11%
1 gen 1988 anni
0.778
-0.004
-0.52%
1 gen 1989 anni
0.794
+0.016
2.05%
1 gen 1990 anni
0.799
+0.006
0.7%
1 gen 1991 anni
0.804
+0.004
0.56%
1 gen 1992 anni
0.815
+0.011
1.41%
1 gen 1993 anni
0.827
+0.012
1.44%
1 gen 1994 anni
0.839
+0.012
1.42%
1 gen 1995 anni
0.84
+0.001
0.14%
1 gen 1996 anni
0.852
+0.012
1.44%
1 gen 1997 anni
0.852
+0.0
0.04%
1 gen 1998 anni
0.872
+0.02
2.37%
1 gen 1999 anni
0.89
+0.018
2.04%
1 gen 2000 anni
0.913
+0.023
2.6%
1 gen 2001 anni
0.926
+0.013
1.41%
1 gen 2002 anni
0.931
+0.005
0.52%
1 gen 2003 anni
0.959
+0.028
2.96%
1 gen 2004 anni
0.959
+0.001
0.06%
1 gen 2005 anni
0.971
+0.012
1.26%
1 gen 2006 anni
0.989
+0.018
1.84%
1 gen 2007 anni
1.013
+0.024
2.4%
1 gen 2008 anni
1.022
+0.009
0.93%
1 gen 2009 anni
1.032
+0.009
0.91%
1 gen 2010 anni
1.034
+0.003
0.25%
1 gen 2011 anni
1.036
+0.002
0.19%
1 gen 2012 anni
1.038
+0.002
0.18%
1 gen 2013 anni
1.068
+0.03
2.86%
1 gen 2014 anni
1.087
+0.02
1.86%
1 gen 2015 anni
1.095
+0.007
0.65%
Classificazione dei paesi secondo i statistiche attuali per anni


Commenti: