29
/it/
it
AIzaSyAYiBZKx7MnpbEhh9jyipgxe19OcubqV5w
April 1, 2024
51236
Middle income
MIC
false
2
1
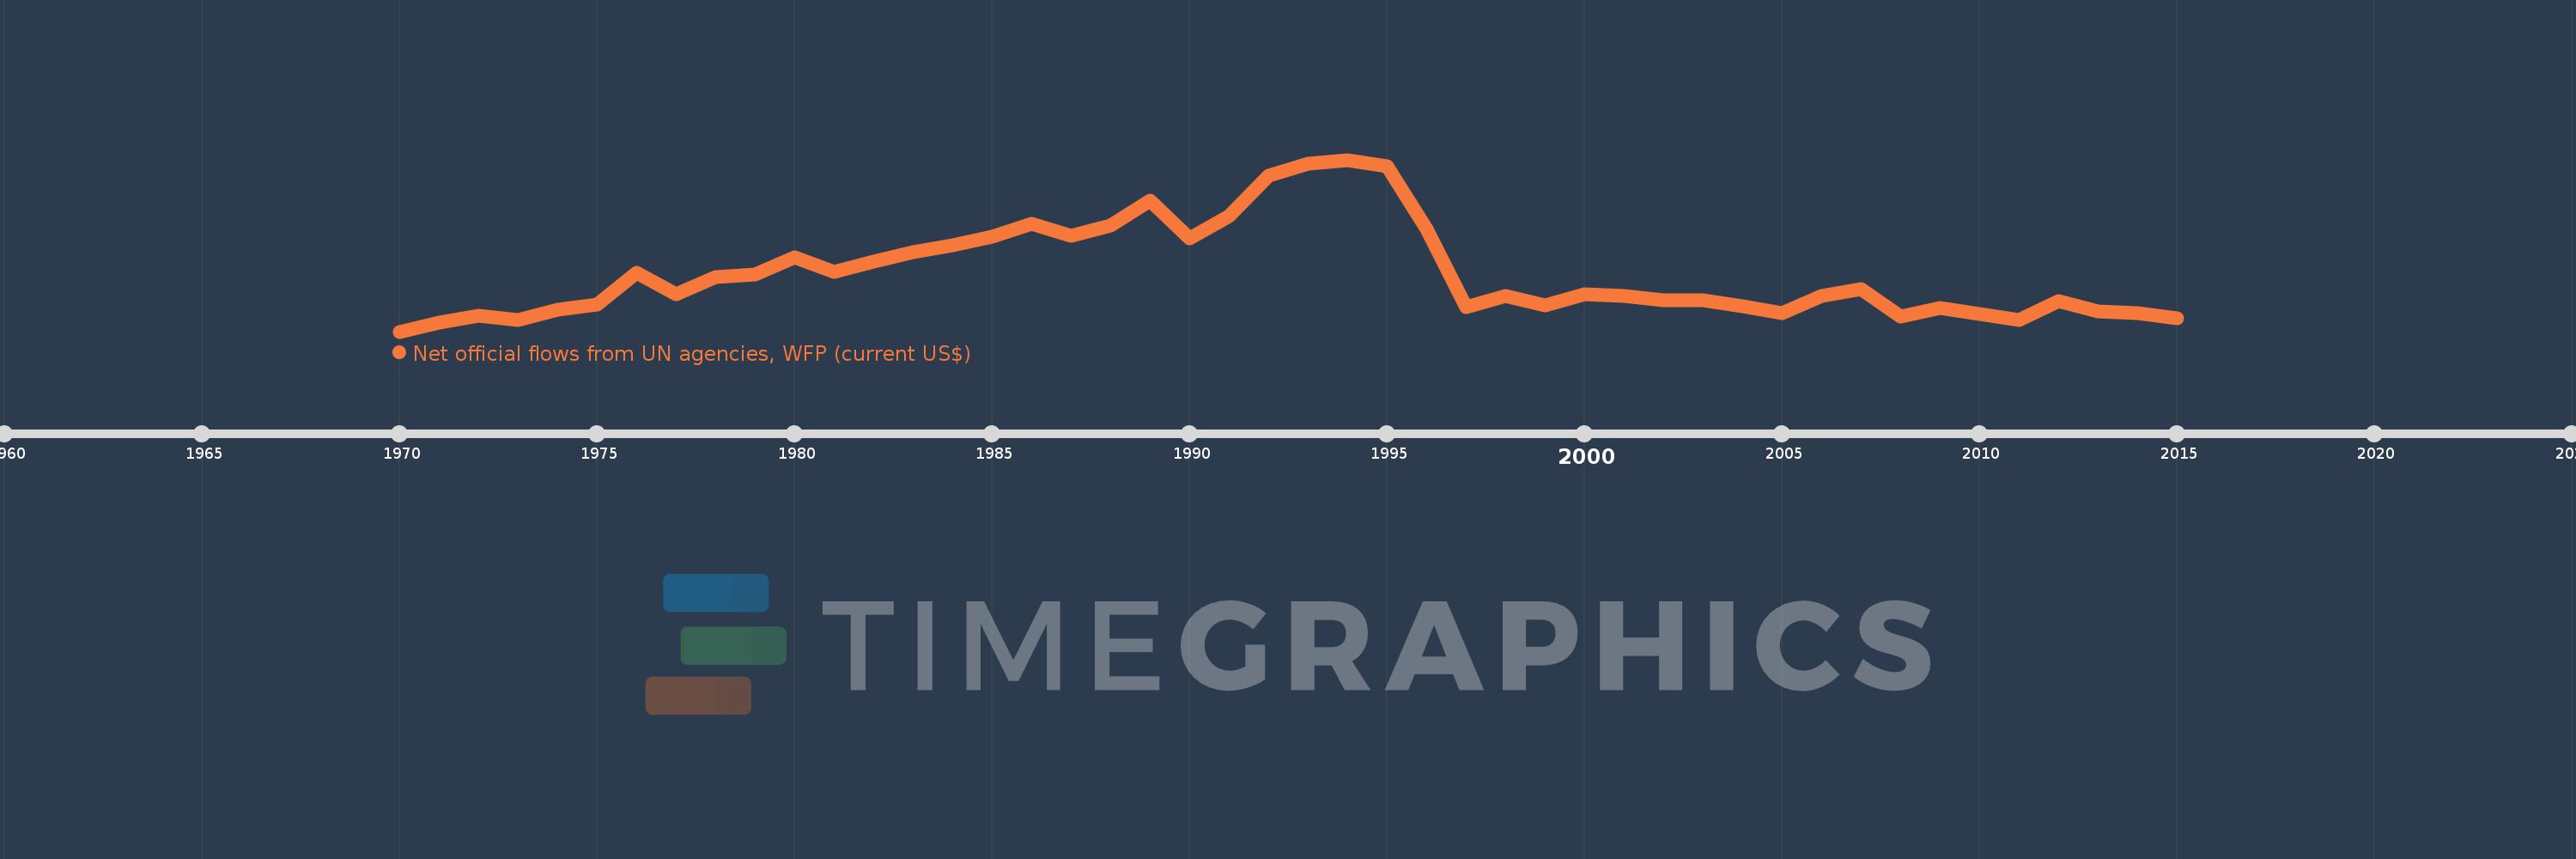
Net official flows from UN agencies, WFP (current US$)
2015,2014,2013,2012,2011,2010,2009,2008,2007,2006,2005,2004,2003,2002,2001,2000,1999,1998,1997,1996,1995,1994,1993,1992,1991,1990,1989,1988,1987,1986,1985,1984,1983,1982,1981,1980,1979,1978,1977,1976,1975,1974,1973,1972,1971,1970
Queste statistiche in altri paesi:
AfghanistanAlbaniaAlgeriaAngolaAntigua and BarbudaArab WorldArgentinaArmeniaAzerbaijanBangladeshBarbadosBelizeBeninBhutanBoliviaBosnia and HerzegovinaBotswanaBrazilBulgariaBurkina FasoBurundiCabo VerdeCambodiaCameroonCaribbean small statesCentral African RepublicCentral Europe and the BalticsChadChileChinaColombiaComorosCongo, Dem. Rep.Congo, Rep.Costa RicaCote d'IvoireCubaCyprusDjiboutiDominicaDominican RepublicEast Asia & PacificEast Asia & Pacific (excluding high income)East Asia & Pacific (IDA & IBRD countries)EcuadorEgypt, Arab Rep.El SalvadorEquatorial GuineaEritreaEstoniaEthiopiaEuro areaEurope & Central AsiaEurope & Central Asia (excluding high income)Europe & Central Asia (IDA & IBRD countries)European UnionFijiFragile and conflict affected situationsGabonGambia, TheGeorgiaGhanaGrenadaGuatemalaGuineaGuinea-BissauGuyanaHaitiHeavily indebted poor countries (HIPC)High incomeHondurasIBRD onlyIDA & IBRD totalIDA blendIDA onlyIDA totalIndiaIndonesiaIran, Islamic Rep.IraqJamaicaJordanKenyaKorea, Dem. People’s Rep.Korea, Rep.KuwaitKyrgyz RepublicLao PDRLatin America & Caribbean Latin America & Caribbean (excluding high income)Latin America & the Caribbean (IDA & IBRD countries)Least developed countries: UN classificationLebanonLesothoLiberiaLibyaLow & middle incomeLow incomeLower middle incomeMacedonia, FYRMadagascarMalawiMalaysiaMaldivesMaliMaltaMauritaniaMauritiusMexicoMiddle East & North AfricaMiddle East & North Africa (excluding high income)Middle East & North Africa (IDA & IBRD countries)Middle incomeMoldovaMongoliaMoroccoMozambiqueMyanmarNamibiaNepalNicaraguaNigerNigeriaOECD membersOmanOther small statesPacific island small statesPakistanPanamaPapua New GuineaParaguayPeruPhilippinesPolandRomaniaRussian FederationRwandaSamoaSao Tome and PrincipeSenegalSerbiaSeychellesSierra LeoneSingaporeSmall statesSolomon IslandsSomaliaSouth AfricaSouth AsiaSouth Asia (IDA & IBRD)South SudanSri LankaSt. Kitts and NevisSt. LuciaSt. Vincent and the GrenadinesSub-Saharan Africa Sub-Saharan Africa (excluding high income)Sub-Saharan Africa (IDA & IBRD countries)SudanSurinameSwazilandSyrian Arab RepublicTajikistanTanzaniaThailandTimor-LesteTogoTongaTrinidad and TobagoTunisiaTurkeyTurkmenistanUgandaUnited Arab EmiratesUpper middle incomeUruguayVanuatuVenezuela, RBVietnamWest Bank and GazaWorldYemen, Rep.ZambiaZimbabwe Linea del tempo:
Questa scala temporale mostra un grafico dal 1970 anno al 2015 anno. Middle income. I dati fino ad 1969 anno non disponibili. Il numero di osservazioni attuali secondo i date: 46.
La fonte (nome):
Indicatori dello sviluppo mondiale
La fonte (organizzazione):
Development Assistance Committee of the Organisation for Economic Co-operation and Development, Geographical Distribution of Financial Flows to Developing Countries, Development Co-operation Report, and International Development Statistics database. Data are available online at: www.oecd.org/dac/stats/idsonline.
Categorie:
Aid Effectiveness
sono stati aggiornati
23 apr 2017 anni
Indicatori delle variazioni dei valori per anni
Minima:
49.94 Mln
1 gen 1970 anni
Massimo:
849.66 Mln
1 gen 1994 anni
Alla data di osservazione
Valore
Variazione assoluta
La variazione rispetto al valore precedente
1 gen 1970 anni
49.94 Mln
+49.94 Mln
0.0%
1 gen 1971 anni
92.8 Mln
+42.86 Mln
85.82%
1 gen 1972 anni
122.1 Mln
+29.3 Mln
31.57%
1 gen 1973 anni
103.78 Mln
-18.32 Mln
-15.0%
1 gen 1974 anni
150.32 Mln
+46.54 Mln
44.84%
1 gen 1975 anni
174.08 Mln
+23.76 Mln
15.81%
1 gen 1976 anni
325.13 Mln
+151.05 Mln
86.77%
1 gen 1977 anni
223.12 Mln
-102.01 Mln
-31.38%
1 gen 1978 anni
304.17 Mln
+81.05 Mln
36.33%
1 gen 1979 anni
313.93 Mln
+9.76 Mln
3.21%
1 gen 1980 anni
396.79 Mln
+82.86 Mln
26.39%
1 gen 1981 anni
328.84 Mln
-67.95 Mln
-17.12%
1 gen 1982 anni
375.09 Mln
+46.25 Mln
14.06%
1 gen 1983 anni
418.88 Mln
+43.79 Mln
11.67%
1 gen 1984 anni
449.92 Mln
+31.04 Mln
7.41%
1 gen 1985 anni
493.04 Mln
+43.12 Mln
9.58%
1 gen 1986 anni
552.13 Mln
+59.09 Mln
11.98%
1 gen 1987 anni
496.09 Mln
-56.04 Mln
-10.15%
1 gen 1988 anni
543.36 Mln
+47.27 Mln
9.53%
1 gen 1989 anni
659.88 Mln
+116.52 Mln
21.44%
1 gen 1990 anni
484.06 Mln
-175.82 Mln
-26.64%
1 gen 1991 anni
587.85 Mln
+103.79 Mln
21.44%
1 gen 1992 anni
776.95 Mln
+189.1 Mln
32.17%
1 gen 1993 anni
832.79 Mln
+55.84 Mln
7.19%
1 gen 1994 anni
849.66 Mln
+16.87 Mln
2.03%
1 gen 1995 anni
820.86 Mln
-28.8 Mln
-3.39%
1 gen 1996 anni
527.48 Mln
-293.38 Mln
-35.74%
1 gen 1997 anni
164.56 Mln
-362.92 Mln
-68.8%
1 gen 1998 anni
214.2 Mln
+49.64 Mln
30.17%
1 gen 1999 anni
173.62 Mln
-40.58 Mln
-18.94%
1 gen 2000 anni
224.28 Mln
+50.66 Mln
29.18%
1 gen 2001 anni
217.01 Mln
-7.27 Mln
-3.24%
1 gen 2002 anni
195.51 Mln
-21.5 Mln
-9.91%
1 gen 2003 anni
197.51 Mln
+2.0 Mln
1.02%
1 gen 2004 anni
166.84 Mln
-30.67 Mln
-15.53%
1 gen 2005 anni
135.81 Mln
-31.03 Mln
-18.6%
1 gen 2006 anni
215.4 Mln
+79.59 Mln
58.6%
1 gen 2007 anni
247.2 Mln
+31.8 Mln
14.76%
1 gen 2008 anni
121.24 Mln
-125.96 Mln
-50.95%
1 gen 2009 anni
160.57 Mln
+39.33 Mln
32.44%
1 gen 2010 anni
132.66 Mln
-27.91 Mln
-17.38%
1 gen 2011 anni
105.33 Mln
-27.33 Mln
-20.6%
1 gen 2012 anni
193.37 Mln
+88.04 Mln
83.58%
1 gen 2013 anni
142.19 Mln
-51.18 Mln
-26.47%
1 gen 2014 anni
134.04 Mln
-8.15 Mln
-5.73%
1 gen 2015 anni
113.34 Mln
-20.7 Mln
-15.44%
Classificazione dei paesi secondo i statistiche attuali per anni


Commenti: