29
/it/
it
AIzaSyAYiBZKx7MnpbEhh9jyipgxe19OcubqV5w
April 1, 2024
50316
Middle East & North Africa (IDA & IBRD countries)
TMN
false
2
1
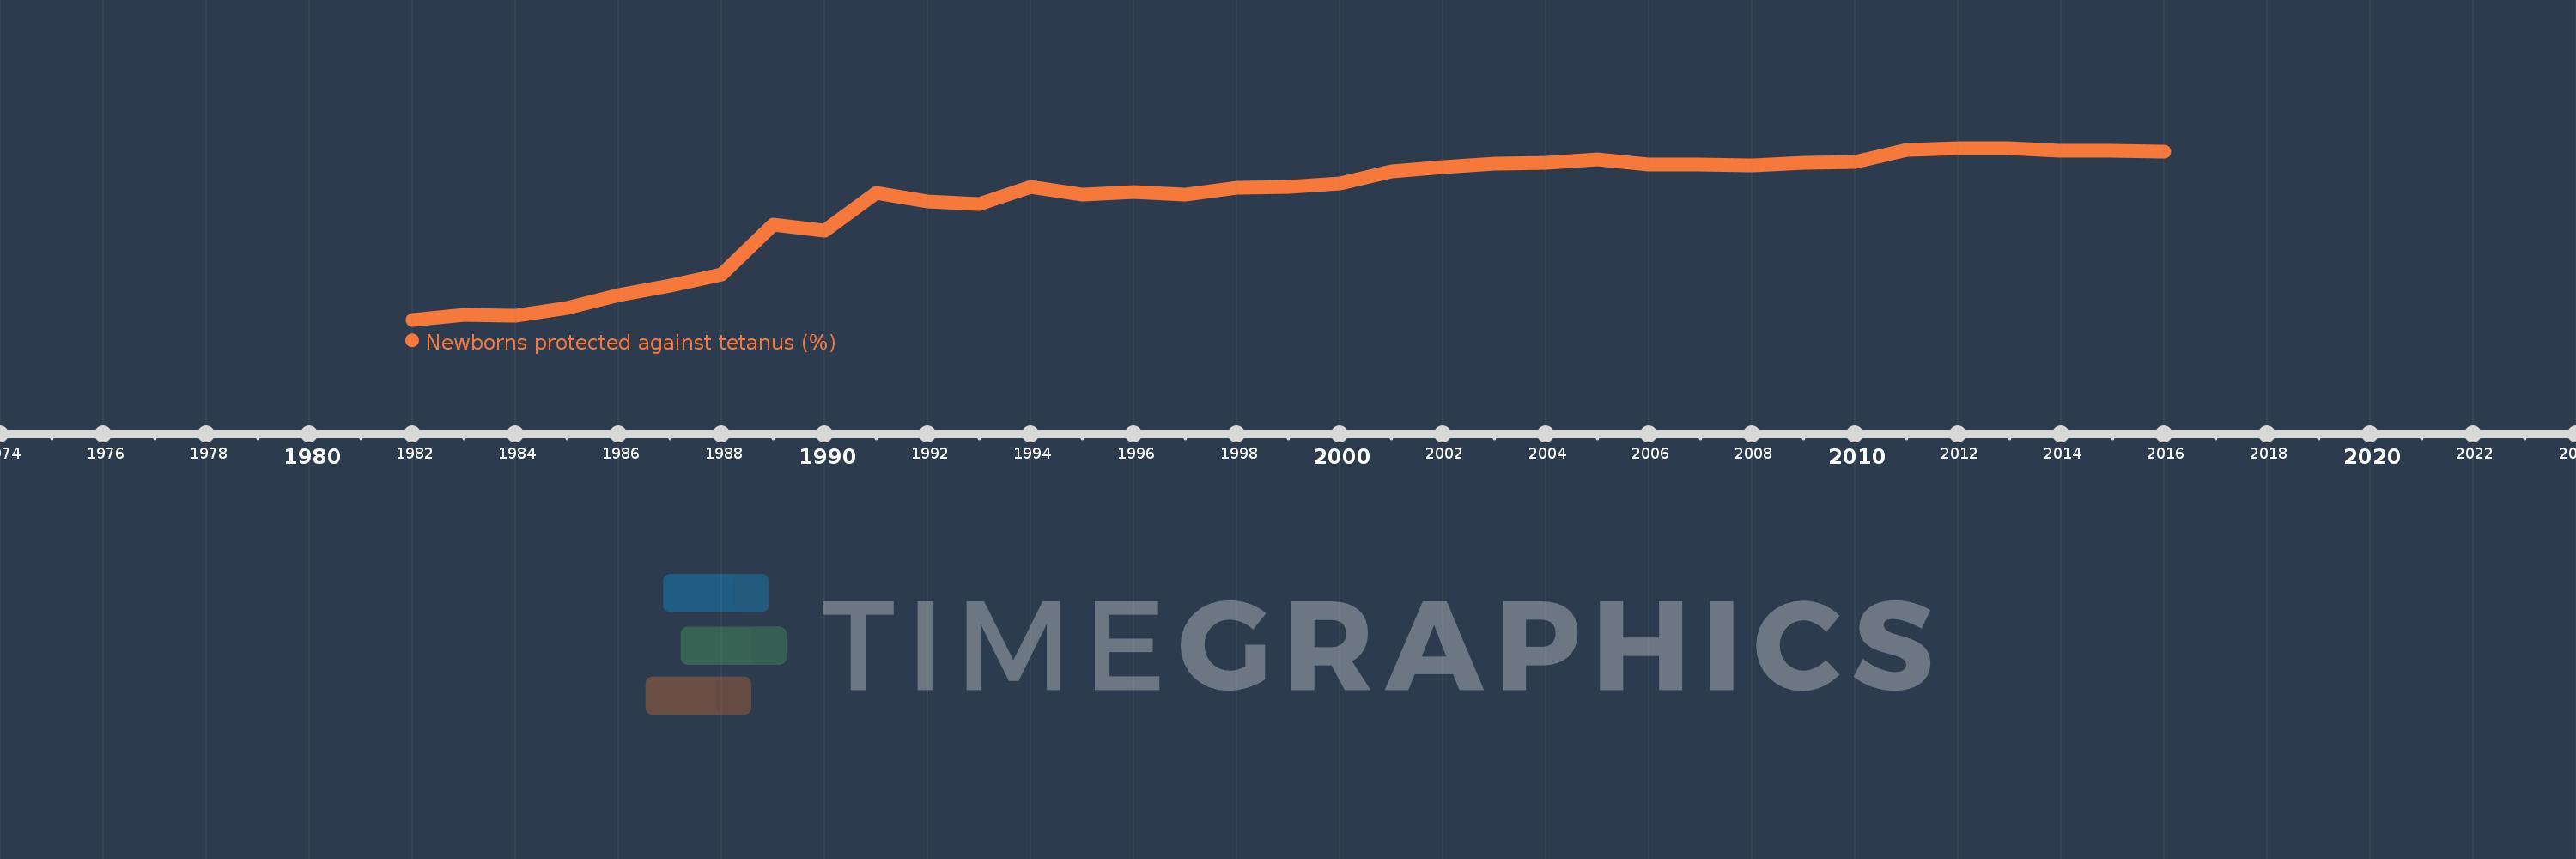
Newborns protected against tetanus (%)
2016,2015,2014,2013,2012,2011,2010,2009,2008,2007,2006,2005,2004,2003,2002,2001,2000,1999,1998,1997,1996,1995,1994,1993,1992,1991,1990,1989,1988,1987,1986,1985,1984,1983,1982
Queste statistiche in altri paesi:
Linea del tempo:
Questa scala temporale mostra un grafico dal 1982 anno al 2016 anno. Middle East & North Africa (IDA & IBRD countries). I dati fino ad 1981 anno non disponibili. Il numero di osservazioni attuali secondo i date: 35.
La fonte (nome):
Indicatori dello sviluppo mondiale
La fonte (organizzazione):
WHO and UNICEF (http://www.who.int/immunization/monitoring_surveillance/en/).
Categorie:
Health
sono stati aggiornati
23 apr 2017 anni
Indicatori delle variazioni dei valori per anni
Minima:
4.955
1 gen 1982 anni
Massimo:
86.853
1 gen 2012 anni
Alla data di osservazione
Valore
Variazione assoluta
La variazione rispetto al valore precedente
1 gen 1982 anni
4.955
+4.955
0.0%
1 gen 1983 anni
7.172
+2.216
44.72%
1 gen 1984 anni
7.055
-0.117
-1.63%
1 gen 1985 anni
10.649
+3.594
50.95%
1 gen 1986 anni
16.577
+5.928
55.66%
1 gen 1987 anni
21.362
+4.785
28.87%
1 gen 1988 anni
26.525
+5.163
24.17%
1 gen 1989 anni
50.213
+23.688
89.3%
1 gen 1990 anni
47.359
-2.854
-5.68%
1 gen 1991 anni
65.262
+17.903
37.8%
1 gen 1992 anni
61.239
-4.023
-6.16%
1 gen 1993 anni
59.982
-1.257
-2.05%
1 gen 1994 anni
68.275
+8.292
13.82%
1 gen 1995 anni
64.462
-3.813
-5.58%
1 gen 1996 anni
65.667
+1.205
1.87%
1 gen 1997 anni
64.668
-0.998
-1.52%
1 gen 1998 anni
68.004
+3.336
5.16%
1 gen 1999 anni
68.179
+0.175
0.26%
1 gen 2000 anni
69.984
+1.805
2.65%
1 gen 2001 anni
75.544
+5.56
7.95%
1 gen 2002 anni
77.618
+2.074
2.75%
1 gen 2003 anni
79.545
+1.927
2.48%
1 gen 2004 anni
79.59
+0.044
0.06%
1 gen 2005 anni
81.233
+1.643
2.06%
1 gen 2006 anni
78.864
-2.369
-2.92%
1 gen 2007 anni
79.046
+0.182
0.23%
1 gen 2008 anni
78.397
-0.648
-0.82%
1 gen 2009 anni
79.955
+1.558
1.99%
1 gen 2010 anni
79.982
+0.027
0.03%
1 gen 2011 anni
86.109
+6.127
7.66%
1 gen 2012 anni
86.853
+0.745
0.86%
1 gen 2013 anni
86.827
-0.027
-0.03%
1 gen 2014 anni
85.345
-1.482
-1.71%
1 gen 2015 anni
85.304
-0.041
-0.05%
1 gen 2016 anni
85.161
-0.143
-0.17%
Classificazione dei paesi secondo i statistiche attuali per anni


Commenti: