29
/it/
it
AIzaSyAYiBZKx7MnpbEhh9jyipgxe19OcubqV5w
April 1, 2024
49042
Middle East & North Africa (excluding high income)
MNA
false
2
1
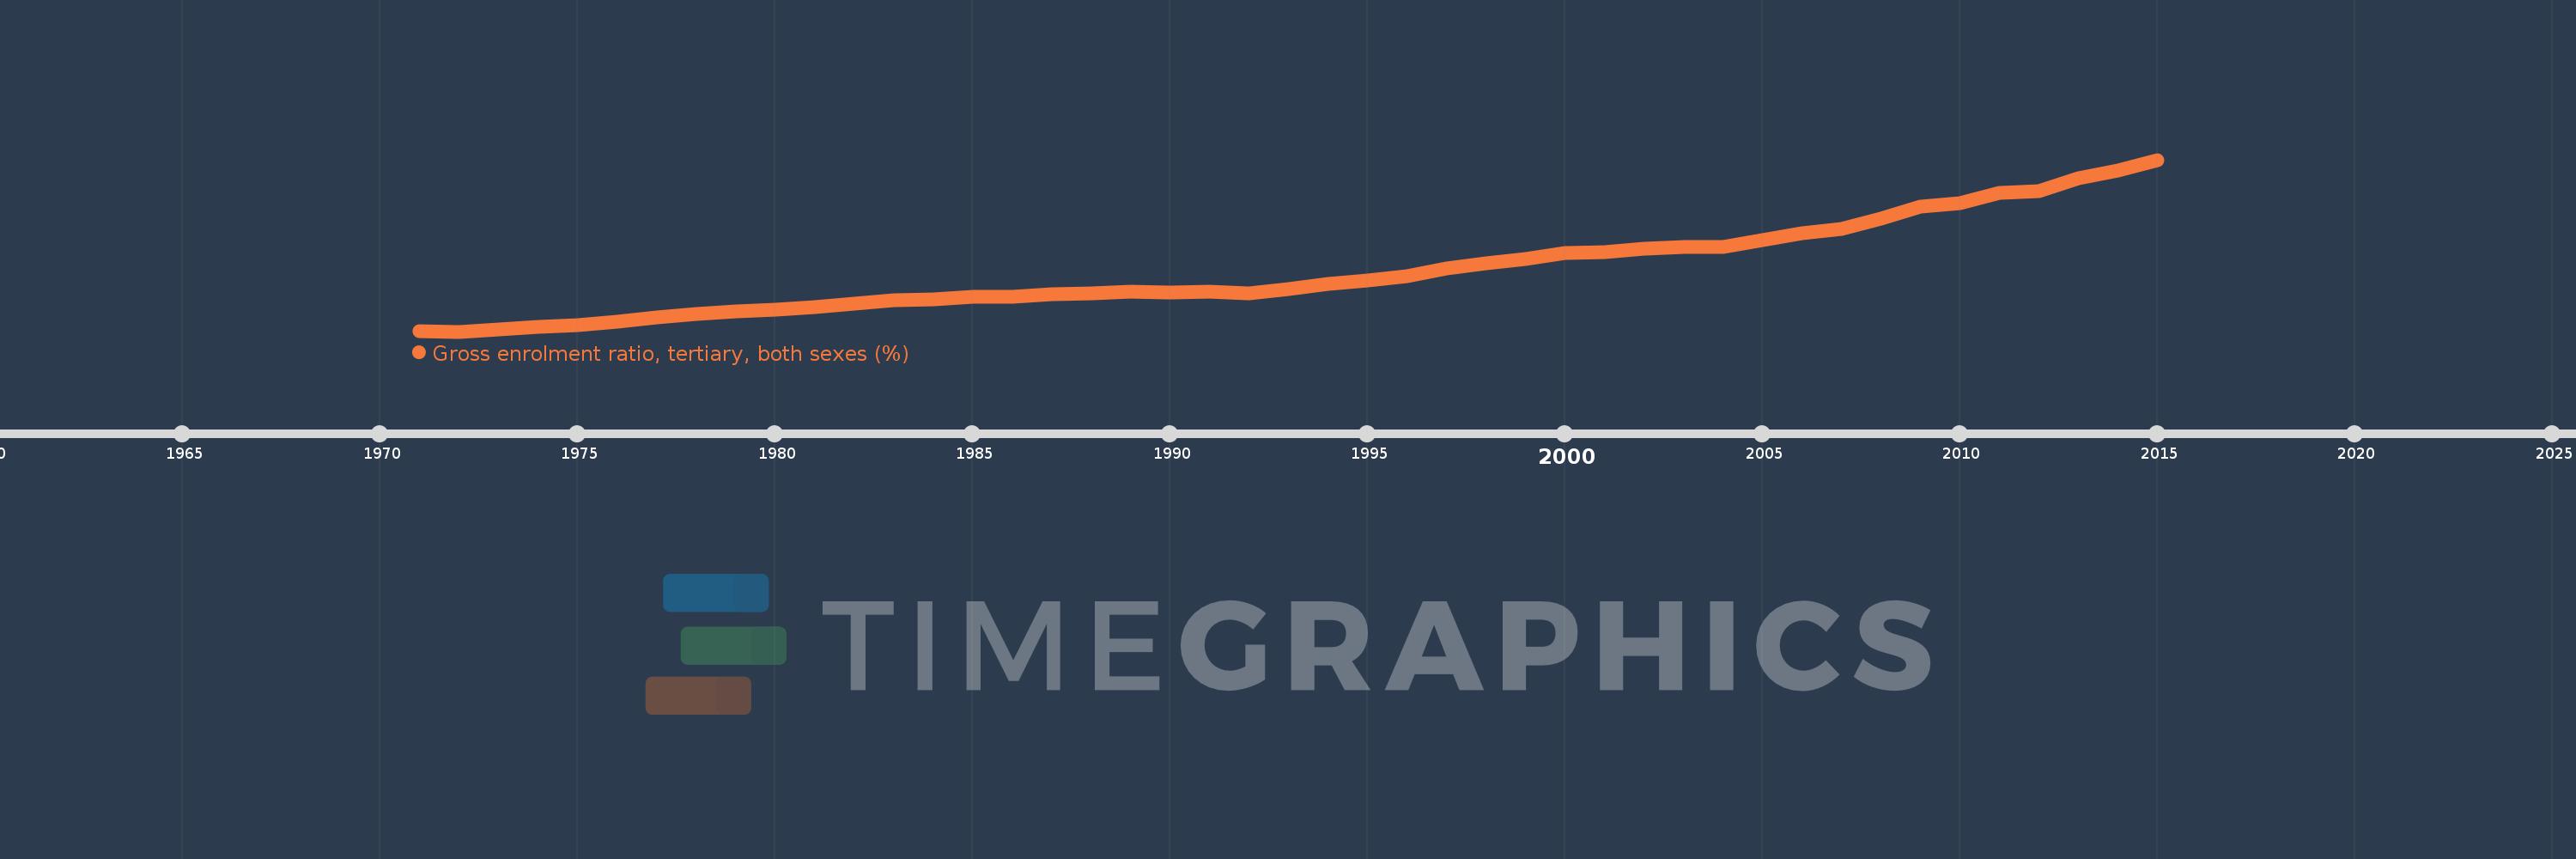
Gross enrolment ratio, tertiary, both sexes (%)
2015,2014,2013,2012,2011,2010,2009,2008,2007,2006,2005,2004,2003,2002,2001,2000,1999,1998,1997,1996,1995,1994,1993,1992,1991,1990,1989,1988,1987,1986,1985,1984,1983,1982,1981,1980,1979,1978,1977,1976,1975,1974,1973,1972,1971
Queste statistiche in altri paesi:
AfghanistanAlbaniaAlgeriaAngolaAntigua and BarbudaArab WorldArgentinaArmeniaArubaAustraliaAustriaAzerbaijanBahamas, TheBahrainBangladeshBarbadosBelarusBelgiumBelizeBeninBermudaBhutanBoliviaBosnia and HerzegovinaBotswanaBrazilBritish Virgin IslandsBrunei DarussalamBulgariaBurkina FasoBurundiCabo VerdeCambodiaCameroonCanadaCaribbean small statesCentral African RepublicCentral Europe and the BalticsChadChileChinaColombiaComorosCongo, Dem. Rep.Congo, Rep.Costa RicaCote d'IvoireCroatiaCubaCuracaoCyprusCzech RepublicDenmarkDjiboutiDominicaDominican RepublicEarly-demographic dividendEast Asia & PacificEast Asia & Pacific (excluding high income)East Asia & Pacific (IDA & IBRD countries)EcuadorEgypt, Arab Rep.El SalvadorEquatorial GuineaEritreaEstoniaEthiopiaEuro areaEurope & Central AsiaEurope & Central Asia (excluding high income)Europe & Central Asia (IDA & IBRD countries)European UnionFijiFinlandFragile and conflict affected situationsFranceGabonGambia, TheGeorgiaGermanyGhanaGreeceGrenadaGuatemalaGuineaGuinea-BissauGuyanaHaitiHeavily indebted poor countries (HIPC)High incomeHondurasHong Kong SAR, ChinaHungaryIBRD onlyIcelandIDA & IBRD totalIDA blendIDA onlyIDA totalIndiaIndonesiaIran, Islamic Rep.IraqIrelandIsraelItalyJamaicaJapanJordanKazakhstanKenyaKorea, Dem. People’s Rep.Korea, Rep.KuwaitKyrgyz RepublicLao PDRLate-demographic dividendLatin America & Caribbean Latin America & Caribbean (excluding high income)Latin America & the Caribbean (IDA & IBRD countries)LatviaLeast developed countries: UN classificationLebanonLesothoLiberiaLibyaLiechtensteinLithuaniaLow & middle incomeLow incomeLower middle incomeLuxembourgMacao SAR, ChinaMacedonia, FYRMadagascarMalawiMalaysiaMaldivesMaliMaltaMarshall IslandsMauritaniaMauritiusMexicoMicronesia, Fed. Sts.Middle East & North AfricaMiddle East & North Africa (excluding high income)Middle East & North Africa (IDA & IBRD countries)Middle incomeMoldovaMongoliaMontenegroMoroccoMozambiqueMyanmarNamibiaNepalNetherlandsNew ZealandNicaraguaNigerNigeriaNorth AmericaNorwayOECD membersOmanOther small statesPacific island small statesPakistanPalauPanamaPapua New GuineaParaguayPeruPhilippinesPolandPortugalPost-demographic dividendPre-demographic dividendPuerto RicoQatarRomaniaRussian FederationRwandaSamoaSan MarinoSao Tome and PrincipeSaudi ArabiaSenegalSerbiaSeychellesSierra LeoneSingaporeSlovak RepublicSloveniaSmall statesSomaliaSouth AfricaSouth AsiaSouth Asia (IDA & IBRD)SpainSri LankaSt. Kitts and NevisSt. LuciaSt. Vincent and the GrenadinesSub-Saharan Africa Sub-Saharan Africa (excluding high income)Sub-Saharan Africa (IDA & IBRD countries)SudanSurinameSwazilandSwedenSwitzerlandSyrian Arab RepublicTajikistanTanzaniaThailandTimor-LesteTogoTongaTrinidad and TobagoTunisiaTurkeyTurkmenistanUgandaUkraineUnited Arab EmiratesUnited KingdomUnited StatesUpper middle incomeUruguayUzbekistanVanuatuVenezuela, RBVietnamWest Bank and GazaWorldYemen, Rep.ZambiaZimbabwe Linea del tempo:
Questa scala temporale mostra un grafico dal 1971 anno al 2015 anno. Middle East & North Africa (excluding high income). I dati fino ad 1970 anno non disponibili. Il numero di osservazioni attuali secondo i date: 45.
La fonte (nome):
Indicatori dello sviluppo mondiale
La fonte (organizzazione):
UNESCO Institute for Statistics
Categorie:
Education
sono stati aggiornati
23 apr 2017 anni
Indicatori delle variazioni dei valori per anni
Minima:
5.626
1 gen 1972 anni
Massimo:
36.423
1 gen 2015 anni
Alla data di osservazione
Valore
Variazione assoluta
La variazione rispetto al valore precedente
1 gen 1971 anni
5.654
+5.654
0.0%
1 gen 1972 anni
5.626
-0.028
-0.5%
1 gen 1973 anni
5.949
+0.323
5.74%
1 gen 1974 anni
6.415
+0.465
7.82%
1 gen 1975 anni
6.83
+0.415
6.47%
1 gen 1976 anni
7.438
+0.608
8.9%
1 gen 1977 anni
8.177
+0.739
9.94%
1 gen 1978 anni
8.831
+0.654
8.0%
1 gen 1979 anni
9.282
+0.451
5.11%
1 gen 1980 anni
9.501
+0.219
2.36%
1 gen 1981 anni
10.002
+0.501
5.27%
1 gen 1982 anni
10.677
+0.675
6.75%
1 gen 1983 anni
11.184
+0.507
4.75%
1 gen 1984 anni
11.447
+0.263
2.35%
1 gen 1985 anni
11.855
+0.408
3.57%
1 gen 1986 anni
11.897
+0.042
0.35%
1 gen 1987 anni
12.289
+0.392
3.29%
1 gen 1988 anni
12.514
+0.225
1.83%
1 gen 1989 anni
12.736
+0.222
1.77%
1 gen 1990 anni
12.557
-0.179
-1.41%
1 gen 1991 anni
12.715
+0.158
1.26%
1 gen 1992 anni
12.517
-0.198
-1.56%
1 gen 1993 anni
13.228
+0.712
5.69%
1 gen 1994 anni
14.105
+0.877
6.63%
1 gen 1995 anni
14.774
+0.669
4.74%
1 gen 1996 anni
15.572
+0.797
5.4%
1 gen 1997 anni
16.872
+1.3
8.35%
1 gen 1998 anni
17.829
+0.957
5.67%
1 gen 1999 anni
18.616
+0.787
4.42%
1 gen 2000 anni
19.751
+1.135
6.1%
1 gen 2001 anni
19.903
+0.152
0.77%
1 gen 2002 anni
20.468
+0.565
2.84%
1 gen 2003 anni
20.814
+0.346
1.69%
1 gen 2004 anni
20.821
+0.007
0.03%
1 gen 2005 anni
22.098
+1.277
6.13%
1 gen 2006 anni
23.202
+1.104
5.0%
1 gen 2007 anni
24.07
+0.869
3.74%
1 gen 2008 anni
25.84
+1.77
7.35%
1 gen 2009 anni
28.075
+2.236
8.65%
1 gen 2010 anni
28.671
+0.595
2.12%
1 gen 2011 anni
30.425
+1.754
6.12%
1 gen 2012 anni
30.854
+0.429
1.41%
1 gen 2013 anni
33.102
+2.248
7.29%
1 gen 2014 anni
34.527
+1.424
4.3%
1 gen 2015 anni
36.423
+1.896
5.49%
Classificazione dei paesi secondo i statistiche attuali per anni


Commenti: