29
/it/
it
AIzaSyAYiBZKx7MnpbEhh9jyipgxe19OcubqV5w
April 1, 2024
48928
Middle East & North Africa (excluding high income)
MNA
false
2
1
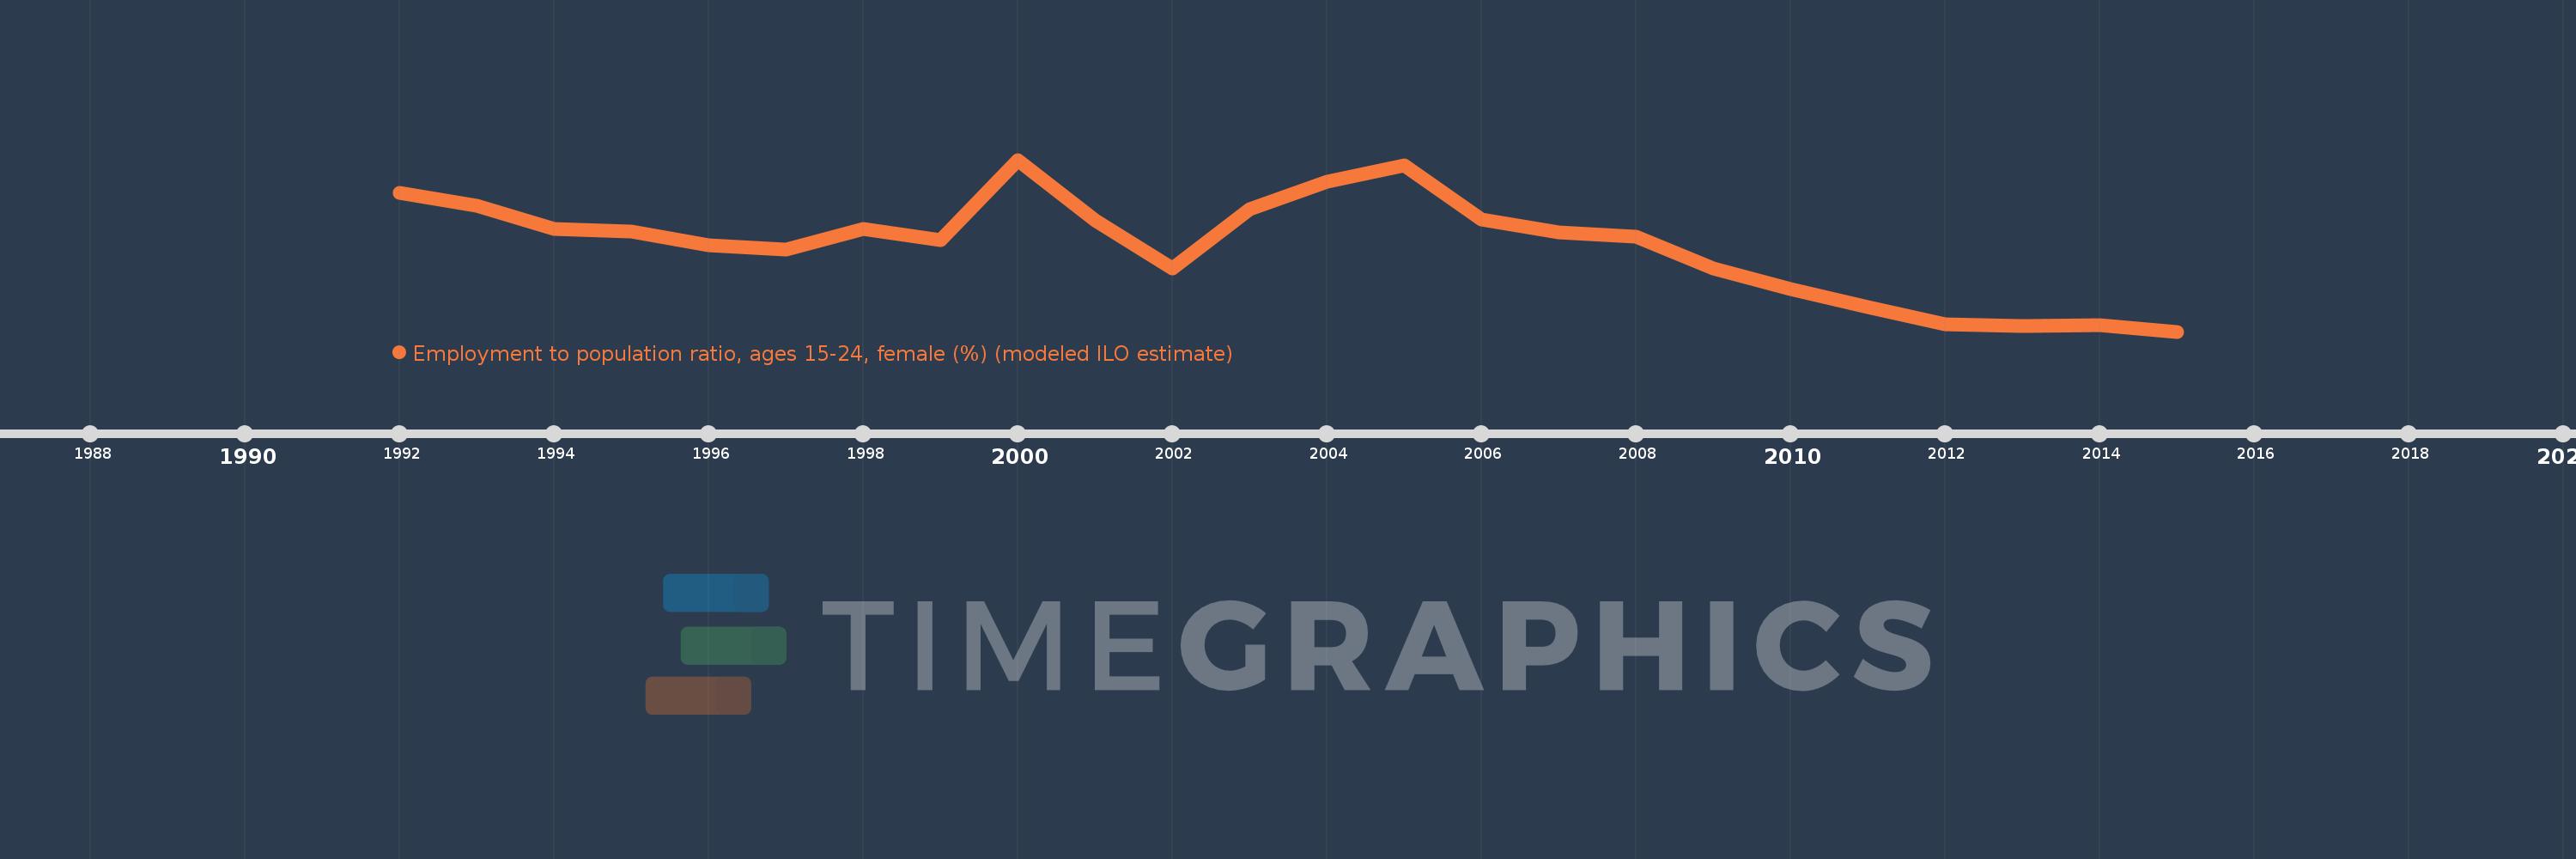
Employment to population ratio, ages 15-24, female (%) (modeled ILO estimate)
2015,2014,2013,2012,2011,2010,2009,2008,2007,2006,2005,2004,2003,2002,2001,2000,1999,1998,1997,1996,1995,1994,1993,1992
Queste statistiche in altri paesi:
AfghanistanAlbaniaAlgeriaAngolaArab WorldArgentinaArmeniaAustraliaAustriaAzerbaijanBahamas, TheBahrainBangladeshBarbadosBelarusBelgiumBelizeBeninBhutanBoliviaBosnia and HerzegovinaBotswanaBrazilBrunei DarussalamBulgariaBurkina FasoBurundiCabo VerdeCambodiaCameroonCanadaCaribbean small statesCentral African RepublicCentral Europe and the BalticsChadChileChinaColombiaComorosCongo, Dem. Rep.Congo, Rep.Costa RicaCote d'IvoireCroatiaCubaCyprusCzech RepublicDenmarkDominican RepublicEarly-demographic dividendEast Asia & PacificEast Asia & Pacific (excluding high income)East Asia & Pacific (IDA & IBRD countries)EcuadorEgypt, Arab Rep.El SalvadorEquatorial GuineaEritreaEstoniaEthiopiaEuro areaEurope & Central AsiaEurope & Central Asia (excluding high income)Europe & Central Asia (IDA & IBRD countries)European UnionFijiFinlandFragile and conflict affected situationsFranceGabonGambia, TheGeorgiaGermanyGhanaGreeceGuatemalaGuineaGuinea-BissauGuyanaHaitiHeavily indebted poor countries (HIPC)High incomeHondurasHong Kong SAR, ChinaHungaryIBRD onlyIcelandIDA & IBRD totalIDA blendIDA onlyIDA totalIndiaIndonesiaIran, Islamic Rep.IraqIrelandIsraelItalyJamaicaJapanJordanKazakhstanKenyaKorea, Dem. People’s Rep.Korea, Rep.KuwaitKyrgyz RepublicLao PDRLate-demographic dividendLatin America & Caribbean Latin America & Caribbean (excluding high income)Latin America & the Caribbean (IDA & IBRD countries)LatviaLeast developed countries: UN classificationLebanonLesothoLiberiaLibyaLithuaniaLow & middle incomeLow incomeLower middle incomeLuxembourgMacao SAR, ChinaMacedonia, FYRMadagascarMalawiMalaysiaMaldivesMaliMaltaMauritaniaMauritiusMexicoMiddle East & North AfricaMiddle East & North Africa (excluding high income)Middle East & North Africa (IDA & IBRD countries)Middle incomeMoldovaMongoliaMontenegroMoroccoMozambiqueMyanmarNamibiaNepalNetherlandsNew ZealandNicaraguaNigerNigeriaNorth AmericaNorwayOECD membersOmanOther small statesPakistanPanamaPapua New GuineaParaguayPeruPhilippinesPolandPortugalPost-demographic dividendPre-demographic dividendPuerto RicoQatarRomaniaRussian FederationRwandaSaudi ArabiaSenegalSerbiaSierra LeoneSingaporeSlovak RepublicSloveniaSmall statesSolomon IslandsSomaliaSouth AfricaSouth AsiaSouth Asia (IDA & IBRD)SpainSri LankaSub-Saharan Africa Sub-Saharan Africa (excluding high income)Sub-Saharan Africa (IDA & IBRD countries)SudanSurinameSwazilandSwedenSwitzerlandSyrian Arab RepublicTajikistanTanzaniaThailandTimor-LesteTogoTrinidad and TobagoTunisiaTurkeyTurkmenistanUgandaUkraineUnited Arab EmiratesUnited KingdomUnited StatesUpper middle incomeUruguayUzbekistanVenezuela, RBVietnamWest Bank and GazaWorldYemen, Rep.ZambiaZimbabwe Linea del tempo:
Questa scala temporale mostra un grafico dal 1992 anno al 2015 anno. Middle East & North Africa (excluding high income). I dati fino ad 1991 anno non disponibili. Il numero di osservazioni attuali secondo i date: 24.
La fonte (nome):
Indicatori dello sviluppo mondiale
La fonte (organizzazione):
International Labour Organization, Key Indicators of the Labour Market database.
Categorie:
Social Protection & Labor, Gender
sono stati aggiornati
23 apr 2017 anni
Indicatori delle variazioni dei valori per anni
Minima:
7.908
1 gen 2015 anni
Massimo:
11.04
1 gen 2000 anni
Alla data di osservazione
Valore
Variazione assoluta
La variazione rispetto al valore precedente
1 gen 1992 anni
10.43
+10.43
0.0%
1 gen 1993 anni
10.197
-0.233
-2.23%
1 gen 1994 anni
9.784
-0.413
-4.05%
1 gen 1995 anni
9.735
-0.049
-0.5%
1 gen 1996 anni
9.488
-0.247
-2.54%
1 gen 1997 anni
9.408
-0.08
-0.84%
1 gen 1998 anni
9.786
+0.378
4.02%
1 gen 1999 anni
9.57
-0.217
-2.21%
1 gen 2000 anni
11.04
+1.47
15.36%
1 gen 2001 anni
9.938
-1.102
-9.98%
1 gen 2002 anni
9.061
-0.877
-8.82%
1 gen 2003 anni
10.147
+1.087
11.99%
1 gen 2004 anni
10.634
+0.487
4.8%
1 gen 2005 anni
10.937
+0.303
2.85%
1 gen 2006 anni
9.954
-0.983
-8.99%
1 gen 2007 anni
9.721
-0.233
-2.34%
1 gen 2008 anni
9.636
-0.085
-0.88%
1 gen 2009 anni
9.058
-0.578
-6.0%
1 gen 2010 anni
8.68
-0.378
-4.17%
1 gen 2011 anni
8.361
-0.32
-3.68%
1 gen 2012 anni
8.04
-0.321
-3.84%
1 gen 2013 anni
8.013
-0.027
-0.33%
1 gen 2014 anni
8.02
+0.007
0.08%
1 gen 2015 anni
7.908
-0.111
-1.39%
Classificazione dei paesi secondo i statistiche attuali per anni


Commenti: