29
/it/
it
AIzaSyAYiBZKx7MnpbEhh9jyipgxe19OcubqV5w
April 1, 2024
45412
Low & middle income
LMY
false
2
1
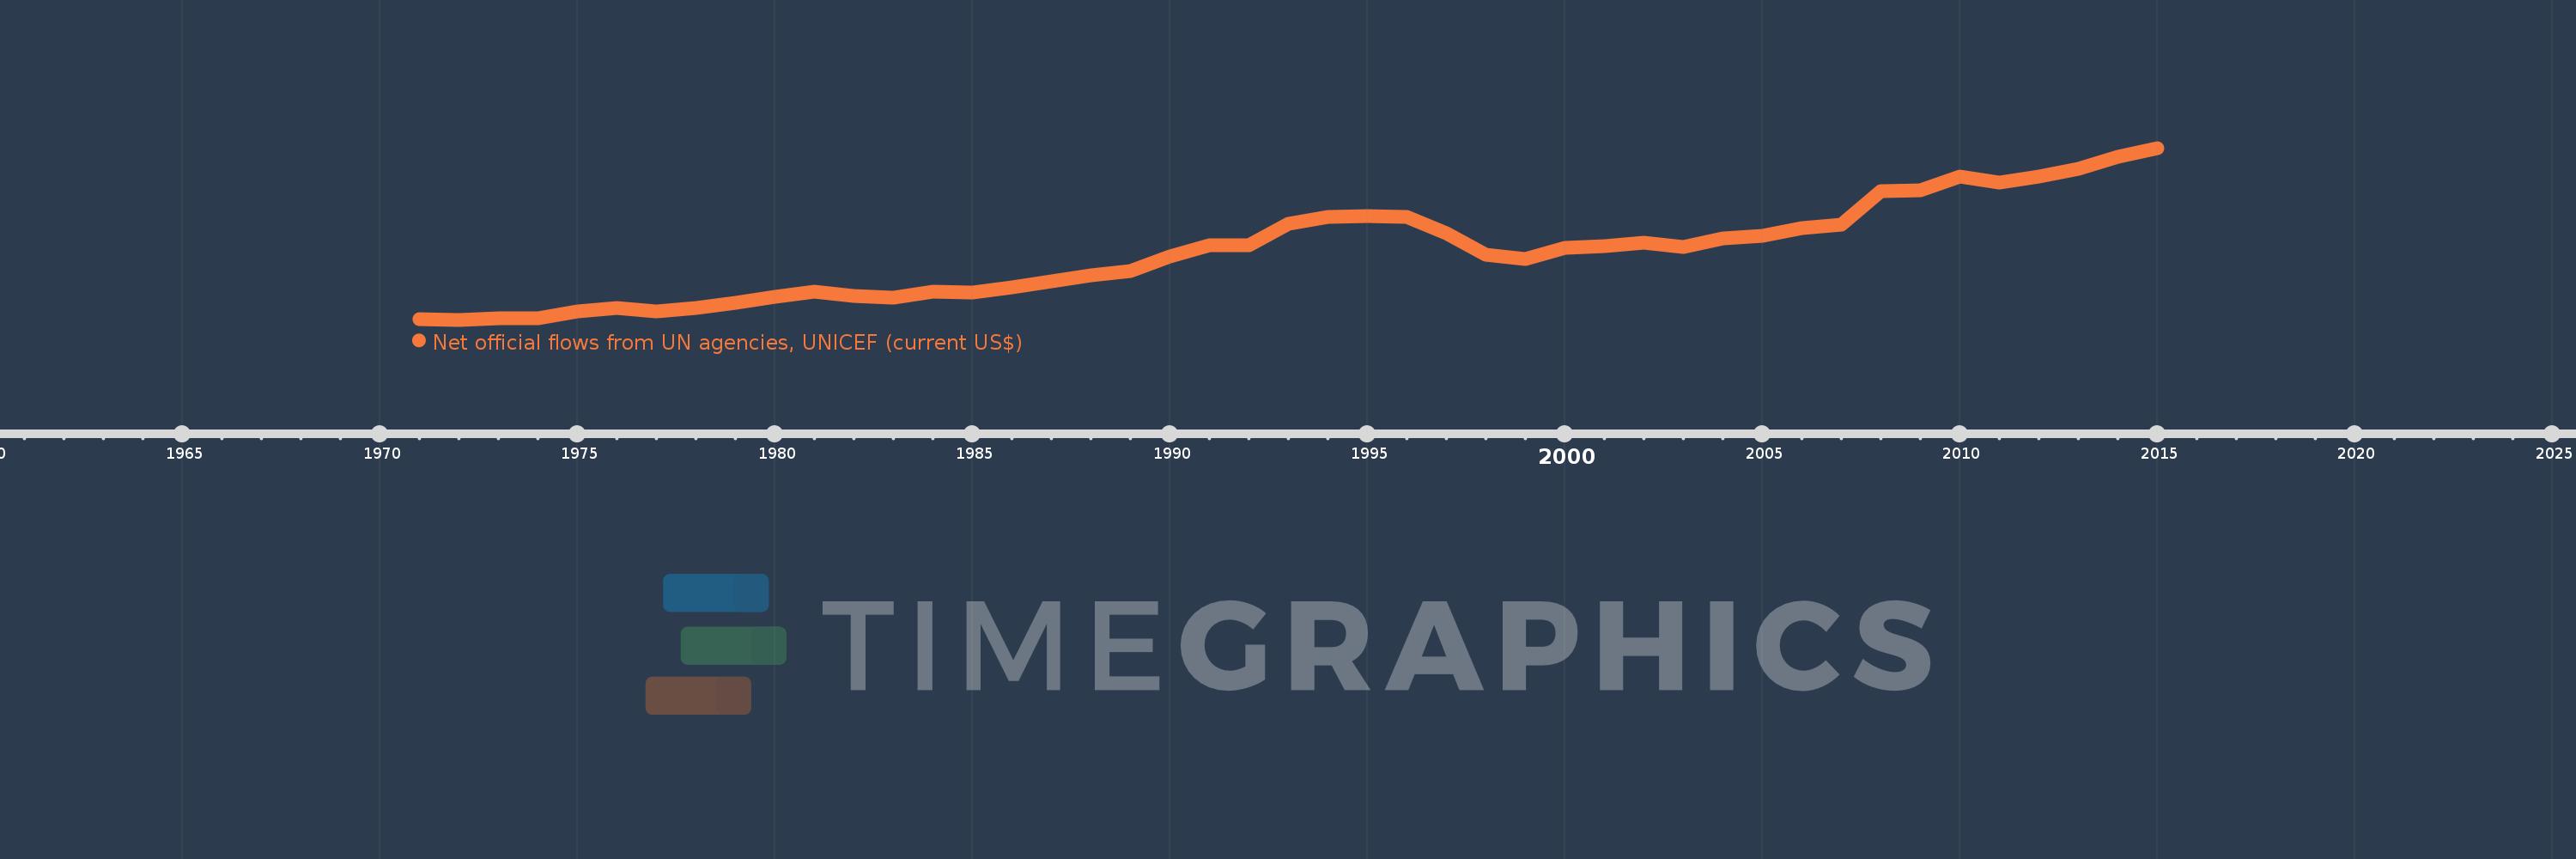
Net official flows from UN agencies, UNICEF (current US$)
2015,2014,2013,2012,2011,2010,2009,2008,2007,2006,2005,2004,2003,2002,2001,2000,1999,1998,1997,1996,1995,1994,1993,1992,1991,1990,1989,1988,1987,1986,1985,1984,1983,1982,1981,1980,1979,1978,1977,1976,1975,1974,1973,1972,1971
Queste statistiche in altri paesi:
AfghanistanAlbaniaAlgeriaAngolaAntigua and BarbudaArab WorldArgentinaArmeniaAzerbaijanBahamas, TheBahrainBangladeshBarbadosBelarusBelizeBeninBhutanBoliviaBosnia and HerzegovinaBotswanaBrazilBulgariaBurkina FasoBurundiCabo VerdeCambodiaCameroonCaribbean small statesCentral African RepublicCentral Europe and the BalticsChadChileChinaColombiaComorosCongo, Dem. Rep.Congo, Rep.Costa RicaCote d'IvoireCroatiaCubaCyprusDjiboutiDominicaDominican RepublicEast Asia & PacificEast Asia & Pacific (excluding high income)East Asia & Pacific (IDA & IBRD countries)EcuadorEgypt, Arab Rep.El SalvadorEquatorial GuineaEritreaEthiopiaEuro areaEurope & Central AsiaEurope & Central Asia (excluding high income)Europe & Central Asia (IDA & IBRD countries)European UnionFijiFragile and conflict affected situationsGabonGambia, TheGeorgiaGhanaGrenadaGuatemalaGuineaGuinea-BissauGuyanaHaitiHeavily indebted poor countries (HIPC)High incomeHondurasHong Kong SAR, ChinaIBRD onlyIDA & IBRD totalIDA blendIDA onlyIDA totalIndiaIndonesiaIran, Islamic Rep.IraqJamaicaJordanKazakhstanKenyaKorea, Dem. People’s Rep.Korea, Rep.KosovoKuwaitKyrgyz RepublicLao PDRLatin America & Caribbean Latin America & Caribbean (excluding high income)Latin America & the Caribbean (IDA & IBRD countries)LatviaLeast developed countries: UN classificationLebanonLesothoLiberiaLibyaLow & middle incomeLow incomeLower middle incomeMacedonia, FYRMadagascarMalawiMalaysiaMaldivesMaliMauritaniaMauritiusMexicoMiddle East & North AfricaMiddle East & North Africa (excluding high income)Middle East & North Africa (IDA & IBRD countries)Middle incomeMoldovaMongoliaMontenegroMoroccoMozambiqueMyanmarNamibiaNepalNicaraguaNigerNigeriaNorthern Mariana IslandsOECD membersOmanOther small statesPacific island small statesPakistanPanamaPapua New GuineaParaguayPeruPhilippinesRomaniaRussian FederationRwandaSamoaSao Tome and PrincipeSaudi ArabiaSenegalSerbiaSeychellesSierra LeoneSingaporeSmall statesSomaliaSouth AfricaSouth AsiaSouth Asia (IDA & IBRD)South SudanSri LankaSt. Kitts and NevisSt. LuciaSt. Vincent and the GrenadinesSub-Saharan Africa Sub-Saharan Africa (excluding high income)Sub-Saharan Africa (IDA & IBRD countries)SudanSurinameSwazilandSyrian Arab RepublicTajikistanTanzaniaThailandTimor-LesteTogoTrinidad and TobagoTunisiaTurkeyTurkmenistanUgandaUkraineUnited Arab EmiratesUpper middle incomeUruguayUzbekistanVanuatuVenezuela, RBVietnamWest Bank and GazaWorldYemen, Rep.ZambiaZimbabwe Linea del tempo:
Questa scala temporale mostra un grafico dal 1971 anno al 2015 anno. Low & middle income. I dati fino ad 1970 anno non disponibili. Il numero di osservazioni attuali secondo i date: 45.
La fonte (nome):
Indicatori dello sviluppo mondiale
La fonte (organizzazione):
Development Assistance Committee of the Organisation for Economic Co-operation and Development, Geographical Distribution of Financial Flows to Developing Countries, Development Co-operation Report, and International Development Statistics database. Data are available online at: www.oecd.org/dac/stats/idsonline.
Categorie:
Aid Effectiveness
sono stati aggiornati
23 apr 2017 anni
Indicatori delle variazioni dei valori per anni
Minima:
41.61 Mln
1 gen 1972 anni
Massimo:
1.29 Mlrd
1 gen 2015 anni
Alla data di osservazione
Valore
Variazione assoluta
La variazione rispetto al valore precedente
1 gen 1971 anni
48.85 Mln
+48.85 Mln
0.0%
1 gen 1972 anni
41.61 Mln
-7.24 Mln
-14.82%
1 gen 1973 anni
53.96 Mln
+12.35 Mln
29.68%
1 gen 1974 anni
55.11 Mln
+1.15 Mln
2.13%
1 gen 1975 anni
99.96 Mln
+44.85 Mln
81.38%
1 gen 1976 anni
124.77 Mln
+24.81 Mln
24.82%
1 gen 1977 anni
99.27 Mln
-25.5 Mln
-20.44%
1 gen 1978 anni
126.62 Mln
+27.35 Mln
27.55%
1 gen 1979 anni
165.8 Mln
+39.18 Mln
30.94%
1 gen 1980 anni
209.32 Mln
+43.52 Mln
26.25%
1 gen 1981 anni
244.65 Mln
+35.33 Mln
16.88%
1 gen 1982 anni
212.96 Mln
-31.69 Mln
-12.95%
1 gen 1983 anni
203.17 Mln
-9.79 Mln
-4.6%
1 gen 1984 anni
243.8 Mln
+40.63 Mln
20.0%
1 gen 1985 anni
242.58 Mln
-1.22 Mln
-0.5%
1 gen 1986 anni
276.43 Mln
+33.85 Mln
13.95%
1 gen 1987 anni
323.57 Mln
+47.14 Mln
17.05%
1 gen 1988 anni
362.99 Mln
+39.42 Mln
12.18%
1 gen 1989 anni
398.17 Mln
+35.18 Mln
9.69%
1 gen 1990 anni
498.68 Mln
+100.51 Mln
25.24%
1 gen 1991 anni
581.45 Mln
+82.77 Mln
16.6%
1 gen 1992 anni
584.56 Mln
+3.11 Mln
0.53%
1 gen 1993 anni
736.94 Mln
+152.38 Mln
26.07%
1 gen 1994 anni
789.86 Mln
+52.92 Mln
7.18%
1 gen 1995 anni
791.88 Mln
+2.02 Mln
0.26%
1 gen 1996 anni
791.72 Mln
-160.0 Mille.
-0.02%
1 gen 1997 anni
671.09 Mln
-120.63 Mln
-15.24%
1 gen 1998 anni
511.57 Mln
-159.52 Mln
-23.77%
1 gen 1999 anni
479.8 Mln
-31.77 Mln
-6.21%
1 gen 2000 anni
563.38 Mln
+83.58 Mln
17.42%
1 gen 2001 anni
574.82 Mln
+11.44 Mln
2.03%
1 gen 2002 anni
600.28 Mln
+25.46 Mln
4.43%
1 gen 2003 anni
567.24 Mln
-33.04 Mln
-5.5%
1 gen 2004 anni
629.55 Mln
+62.31 Mln
10.98%
1 gen 2005 anni
650.89 Mln
+21.34 Mln
3.39%
1 gen 2006 anni
706.88 Mln
+55.99 Mln
8.6%
1 gen 2007 anni
732.82 Mln
+25.94 Mln
3.67%
1 gen 2008 anni
977.32 Mln
+244.5 Mln
33.36%
1 gen 2009 anni
980.3 Mln
+2.98 Mln
0.3%
1 gen 2010 anni
1.081 Mlrd
+101.14 Mln
10.32%
1 gen 2011 anni
1.041 Mlrd
-40.25 Mln
-3.72%
1 gen 2012 anni
1.085 Mlrd
+43.97 Mln
4.22%
1 gen 2013 anni
1.136 Mlrd
+51.13 Mln
4.71%
1 gen 2014 anni
1.226 Mlrd
+89.94 Mln
7.92%
1 gen 2015 anni
1.29 Mlrd
+63.66 Mln
5.19%
Classificazione dei paesi secondo i statistiche attuali per anni


Commenti: