29
/it/
it
AIzaSyAYiBZKx7MnpbEhh9jyipgxe19OcubqV5w
April 1, 2024
44995
Low & middle income
LMY
false
2
1
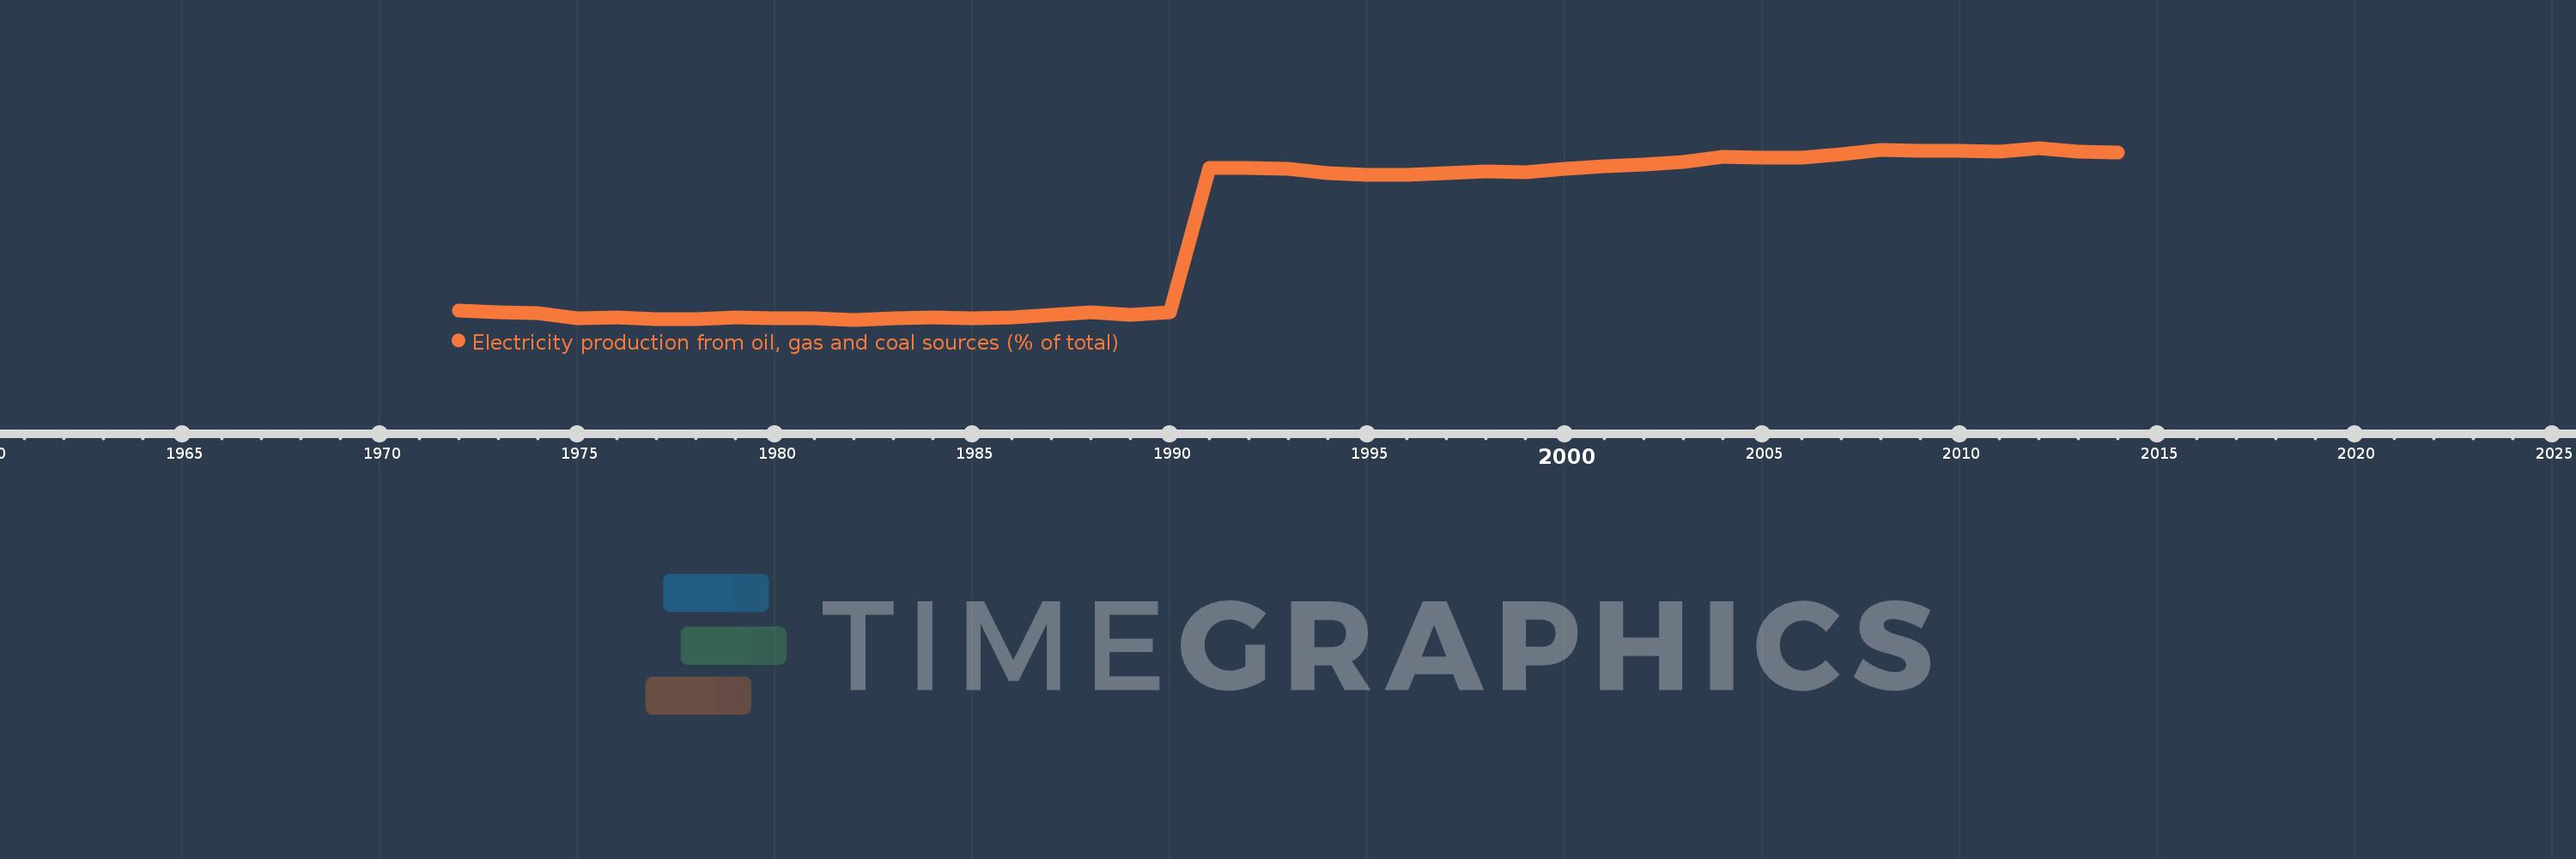
Electricity production from oil, gas and coal sources (% of total)
2014,2013,2012,2011,2010,2009,2008,2007,2006,2005,2004,2003,2002,2001,2000,1999,1998,1997,1996,1995,1994,1993,1992,1991,1990,1989,1988,1987,1986,1985,1984,1983,1982,1981,1980,1979,1978,1977,1976,1975,1974,1973,1972
Queste statistiche in altri paesi:
AlbaniaAlgeriaAngolaArab WorldArgentinaArmeniaAustraliaAustriaAzerbaijanBahrainBangladeshBelarusBelgiumBeninBoliviaBosnia and HerzegovinaBotswanaBrazilBrunei DarussalamBulgariaCambodiaCameroonCanadaCentral Europe and the BalticsChileChinaColombiaCongo, Dem. Rep.Congo, Rep.Costa RicaCote d'IvoireCroatiaCubaCuracaoCyprusCzech RepublicDenmarkDominican RepublicEarly-demographic dividendEast Asia & PacificEast Asia & Pacific (excluding high income)East Asia & Pacific (IDA & IBRD countries)EcuadorEgypt, Arab Rep.El SalvadorEritreaEstoniaEthiopiaEuro areaEurope & Central AsiaEurope & Central Asia (excluding high income)Europe & Central Asia (IDA & IBRD countries)European UnionFinlandFragile and conflict affected situationsFranceGabonGeorgiaGermanyGhanaGibraltarGreeceGuatemalaHaitiHeavily indebted poor countries (HIPC)High incomeHondurasHong Kong SAR, ChinaHungaryIBRD onlyIcelandIDA & IBRD totalIDA blendIDA onlyIDA totalIndiaIndonesiaIran, Islamic Rep.IraqIrelandIsraelItalyJamaicaJapanJordanKazakhstanKenyaKorea, Dem. People’s Rep.Korea, Rep.KosovoKuwaitKyrgyz RepublicLate-demographic dividendLatin America & Caribbean Latin America & Caribbean (excluding high income)Latin America & the Caribbean (IDA & IBRD countries)LatviaLeast developed countries: UN classificationLebanonLibyaLithuaniaLow & middle incomeLower middle incomeLuxembourgMacedonia, FYRMalaysiaMaltaMauritiusMexicoMiddle East & North AfricaMiddle East & North Africa (excluding high income)Middle East & North Africa (IDA & IBRD countries)Middle incomeMoldovaMongoliaMontenegroMoroccoMozambiqueMyanmarNamibiaNepalNetherlandsNew ZealandNicaraguaNigerNigeriaNorth AmericaNorwayOECD membersOmanOther small statesPakistanPanamaParaguayPeruPhilippinesPolandPortugalPost-demographic dividendPre-demographic dividendQatarRomaniaRussian FederationSaudi ArabiaSenegalSerbiaSingaporeSlovak RepublicSloveniaSmall statesSouth AfricaSouth AsiaSouth Asia (IDA & IBRD)South SudanSpainSri LankaSub-Saharan Africa Sub-Saharan Africa (excluding high income)Sub-Saharan Africa (IDA & IBRD countries)SudanSwedenSwitzerlandSyrian Arab RepublicTajikistanTanzaniaThailandTogoTrinidad and TobagoTunisiaTurkeyTurkmenistanUkraineUnited Arab EmiratesUnited KingdomUnited StatesUpper middle incomeUruguayUzbekistanVenezuela, RBVietnamWorldYemen, Rep.ZambiaZimbabwe Linea del tempo:
Questa scala temporale mostra un grafico dal 1972 anno al 2014 anno. Low & middle income. I dati fino ad 1971 anno non disponibili. Il numero di osservazioni attuali secondo i date: 43.
La fonte (nome):
Indicatori dello sviluppo mondiale
La fonte (organizzazione):
IEA Statistics © OECD/IEA 2014 (http://www.iea.org/stats/index.asp), subject to https://www.iea.org/t&c/termsandconditions/
Categorie:
Energy & Mining, Environment
sono stati aggiornati
23 apr 2017 anni
Indicatori delle variazioni dei valori per anni
Minima:
35.011
1 gen 1982 anni
Massimo:
72.73
1 gen 2012 anni
Alla data di osservazione
Valore
Variazione assoluta
La variazione rispetto al valore precedente
1 gen 1972 anni
37.026
+37.026
0.0%
1 gen 1973 anni
36.691
-0.335
-0.9%
1 gen 1974 anni
36.481
-0.211
-0.57%
1 gen 1975 anni
35.319
-1.162
-3.18%
1 gen 1976 anni
35.484
+0.165
0.47%
1 gen 1977 anni
35.088
-0.397
-1.12%
1 gen 1978 anni
35.077
-0.01
-0.03%
1 gen 1979 anni
35.546
+0.469
1.34%
1 gen 1980 anni
35.353
-0.193
-0.54%
1 gen 1981 anni
35.356
+0.003
0.01%
1 gen 1982 anni
35.011
-0.345
-0.98%
1 gen 1983 anni
35.286
+0.275
0.78%
1 gen 1984 anni
35.495
+0.209
0.59%
1 gen 1985 anni
35.327
-0.168
-0.47%
1 gen 1986 anni
35.539
+0.212
0.6%
1 gen 1987 anni
36.002
+0.464
1.3%
1 gen 1988 anni
36.645
+0.642
1.78%
1 gen 1989 anni
36.112
-0.533
-1.45%
1 gen 1990 anni
36.625
+0.513
1.42%
1 gen 1991 anni
68.391
+31.766
86.73%
1 gen 1992 anni
68.275
-0.116
-0.17%
1 gen 1993 anni
68.135
-0.14
-0.21%
1 gen 1994 anni
67.178
-0.958
-1.41%
1 gen 1995 anni
66.835
-0.342
-0.51%
1 gen 1996 anni
66.76
-0.076
-0.11%
1 gen 1997 anni
67.281
+0.521
0.78%
1 gen 1998 anni
67.579
+0.298
0.44%
1 gen 1999 anni
67.481
-0.097
-0.14%
1 gen 2000 anni
68.076
+0.594
0.88%
1 gen 2001 anni
68.776
+0.7
1.03%
1 gen 2002 anni
69.084
+0.308
0.45%
1 gen 2003 anni
69.736
+0.652
0.94%
1 gen 2004 anni
70.793
+1.058
1.52%
1 gen 2005 anni
70.537
-0.257
-0.36%
1 gen 2006 anni
70.68
+0.143
0.2%
1 gen 2007 anni
71.3
+0.619
0.88%
1 gen 2008 anni
72.323
+1.023
1.43%
1 gen 2009 anni
72.12
-0.203
-0.28%
1 gen 2010 anni
72.082
-0.038
-0.05%
1 gen 2011 anni
71.86
-0.222
-0.31%
1 gen 2012 anni
72.73
+0.87
1.21%
1 gen 2013 anni
71.841
-0.888
-1.22%
1 gen 2014 anni
71.7
-0.142
-0.2%
Classificazione dei paesi secondo i statistiche attuali per anni


Commenti: