29
/it/
it
AIzaSyAYiBZKx7MnpbEhh9jyipgxe19OcubqV5w
April 1, 2024
44874
Low & middle income
LMY
false
2
1
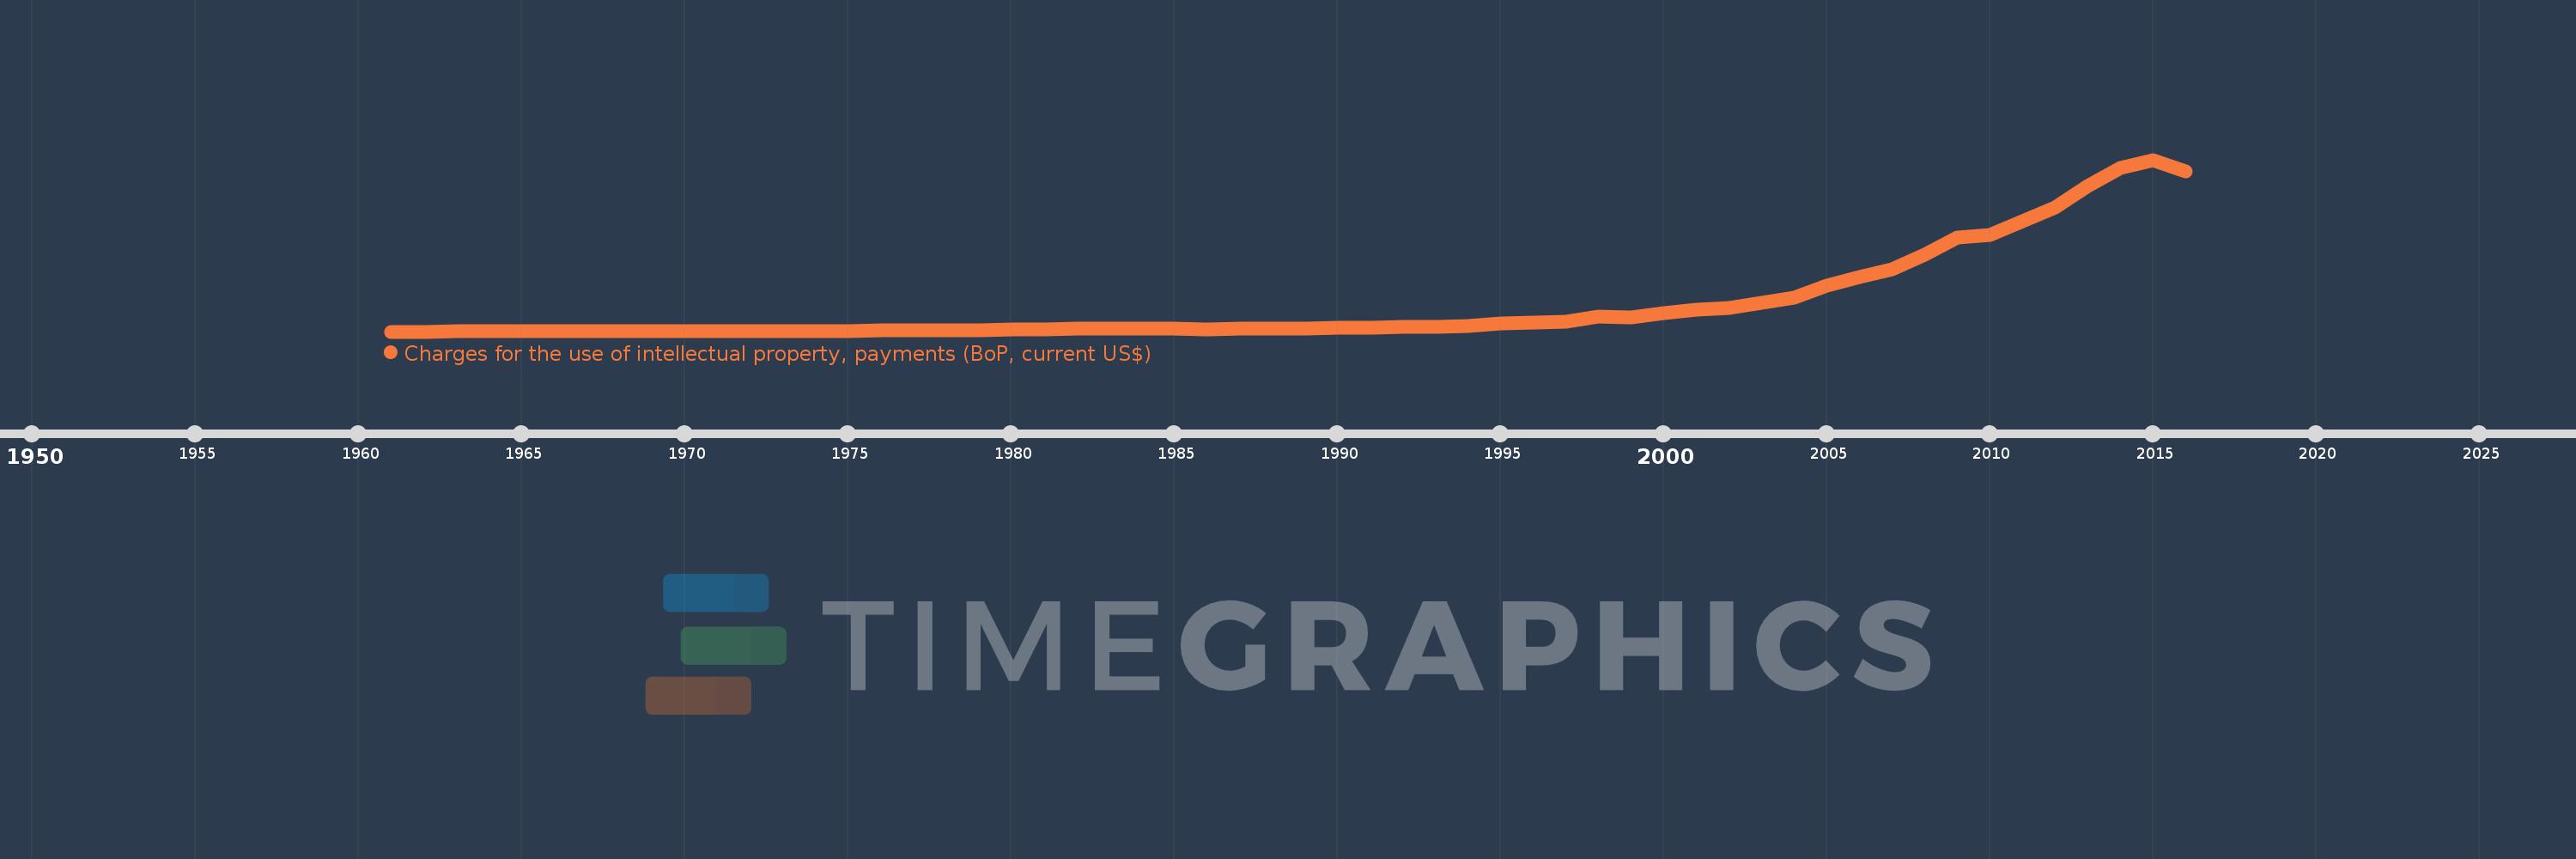
Charges for the use of intellectual property, payments (BoP, current US$)
2016,2015,2014,2013,2012,2011,2010,2009,2008,2007,2006,2005,2004,2003,2002,2001,2000,1999,1998,1997,1996,1995,1994,1993,1992,1991,1990,1989,1988,1987,1986,1985,1984,1983,1982,1981,1980,1979,1978,1977,1976,1975,1974,1973,1972,1971,1970,1969,1968,1967,1966,1965,1964,1963,1962,1961
Queste statistiche in altri paesi:
Linea del tempo:
Questa scala temporale mostra un grafico dal 1961 anno al 2016 anno. Low & middle income. I dati fino ad 1960 anno non disponibili. Il numero di osservazioni attuali secondo i date: 56.
La fonte (nome):
Indicatori dello sviluppo mondiale
La fonte (organizzazione):
International Monetary Fund, Balance of Payments Statistics Yearbook and data files.
Categorie:
Economy & Growth, Science & Technology
sono stati aggiornati
23 apr 2017 anni
Indicatori delle variazioni dei valori per anni
Minima:
5.6 Mln
1 gen 1961 anni
Massimo:
61.004 Mlrd
1 gen 2015 anni
Alla data di osservazione
Valore
Variazione assoluta
La variazione rispetto al valore precedente
1 gen 1961 anni
5.6 Mln
+5.6 Mln
0.0%
1 gen 1962 anni
5.6 Mln
0.0
0.0%
1 gen 1963 anni
8.4 Mln
+2.8 Mln
50.0%
1 gen 1964 anni
15.4 Mln
+7.0 Mln
83.33%
1 gen 1965 anni
15.4 Mln
0.0
0.0%
1 gen 1966 anni
26.6 Mln
+11.2 Mln
72.73%
1 gen 1967 anni
26.6 Mln
0.0
0.0%
1 gen 1968 anni
32.2 Mln
+5.6 Mln
21.05%
1 gen 1969 anni
45.8 Mln
+13.6 Mln
42.24%
1 gen 1970 anni
46.2 Mln
+399.999 Mille.
0.87%
1 gen 1971 anni
56.2 Mln
+10.0 Mln
21.65%
1 gen 1972 anni
48.53 Mln
-7.67 Mln
-13.65%
1 gen 1973 anni
70.29 Mln
+21.76 Mln
44.84%
1 gen 1974 anni
86.424 Mln
+16.134 Mln
22.95%
1 gen 1975 anni
81.141 Mln
-5.282 Mln
-6.11%
1 gen 1976 anni
370.805 Mln
+289.663 Mln
356.99%
1 gen 1977 anni
491.055 Mln
+120.25 Mln
32.43%
1 gen 1978 anni
497.524 Mln
+6.47 Mln
1.32%
1 gen 1979 anni
579.956 Mln
+82.432 Mln
16.57%
1 gen 1980 anni
755.842 Mln
+175.886 Mln
30.33%
1 gen 1981 anni
785.241 Mln
+29.399 Mln
3.89%
1 gen 1982 anni
1.083 Mlrd
+297.438 Mln
37.88%
1 gen 1983 anni
1.052 Mlrd
-30.703 Mln
-2.84%
1 gen 1984 anni
1.065 Mlrd
+12.528 Mln
1.19%
1 gen 1985 anni
948.325 Mln
-116.179 Mln
-10.91%
1 gen 1986 anni
903.563 Mln
-44.762 Mln
-4.72%
1 gen 1987 anni
960.915 Mln
+57.352 Mln
6.35%
1 gen 1988 anni
1.001 Mlrd
+39.804 Mln
4.14%
1 gen 1989 anni
1.087 Mlrd
+85.999 Mln
8.59%
1 gen 1990 anni
1.289 Mlrd
+202.254 Mln
18.61%
1 gen 1991 anni
1.443 Mlrd
+153.595 Mln
11.92%
1 gen 1992 anni
1.582 Mlrd
+139.072 Mln
9.64%
1 gen 1993 anni
1.571 Mlrd
-10.906 Mln
-0.69%
1 gen 1994 anni
1.97 Mlrd
+398.847 Mln
25.39%
1 gen 1995 anni
2.97 Mlrd
+999.937 Mln
50.77%
1 gen 1996 anni
3.088 Mlrd
+118.619 Mln
3.99%
1 gen 1997 anni
3.653 Mlrd
+564.43 Mln
18.28%
1 gen 1998 anni
5.249 Mlrd
+1.596 Mlrd
43.71%
1 gen 1999 anni
4.969 Mlrd
-280.138 Mln
-5.34%
1 gen 2000 anni
6.428 Mlrd
+1.459 Mlrd
29.36%
1 gen 2001 anni
7.907 Mlrd
+1.48 Mlrd
23.02%
1 gen 2002 anni
8.53 Mlrd
+622.286 Mln
7.87%
1 gen 2003 anni
10.28 Mlrd
+1.75 Mlrd
20.52%
1 gen 2004 anni
12.029 Mlrd
+1.749 Mlrd
17.02%
1 gen 2005 anni
16.354 Mlrd
+4.324 Mlrd
35.95%
1 gen 2006 anni
19.523 Mlrd
+3.17 Mlrd
19.38%
1 gen 2007 anni
22.223 Mlrd
+2.7 Mlrd
13.83%
1 gen 2008 anni
27.283 Mlrd
+5.06 Mlrd
22.77%
1 gen 2009 anni
33.289 Mlrd
+6.006 Mlrd
22.01%
1 gen 2010 anni
34.213 Mlrd
+924.018 Mln
2.78%
1 gen 2011 anni
39.249 Mlrd
+5.037 Mlrd
14.72%
1 gen 2012 anni
44.153 Mlrd
+4.903 Mlrd
12.49%
1 gen 2013 anni
51.716 Mlrd
+7.563 Mlrd
17.13%
1 gen 2014 anni
58.016 Mlrd
+6.3 Mlrd
12.18%
1 gen 2015 anni
61.004 Mlrd
+2.988 Mlrd
5.15%
1 gen 2016 anni
56.89 Mlrd
-4.114 Mlrd
-6.74%
Classificazione dei paesi secondo i statistiche attuali per anni


Commenti: