29
/it/
it
AIzaSyAYiBZKx7MnpbEhh9jyipgxe19OcubqV5w
April 1, 2024
44734
Least developed countries: UN classification
LDC
false
2
1
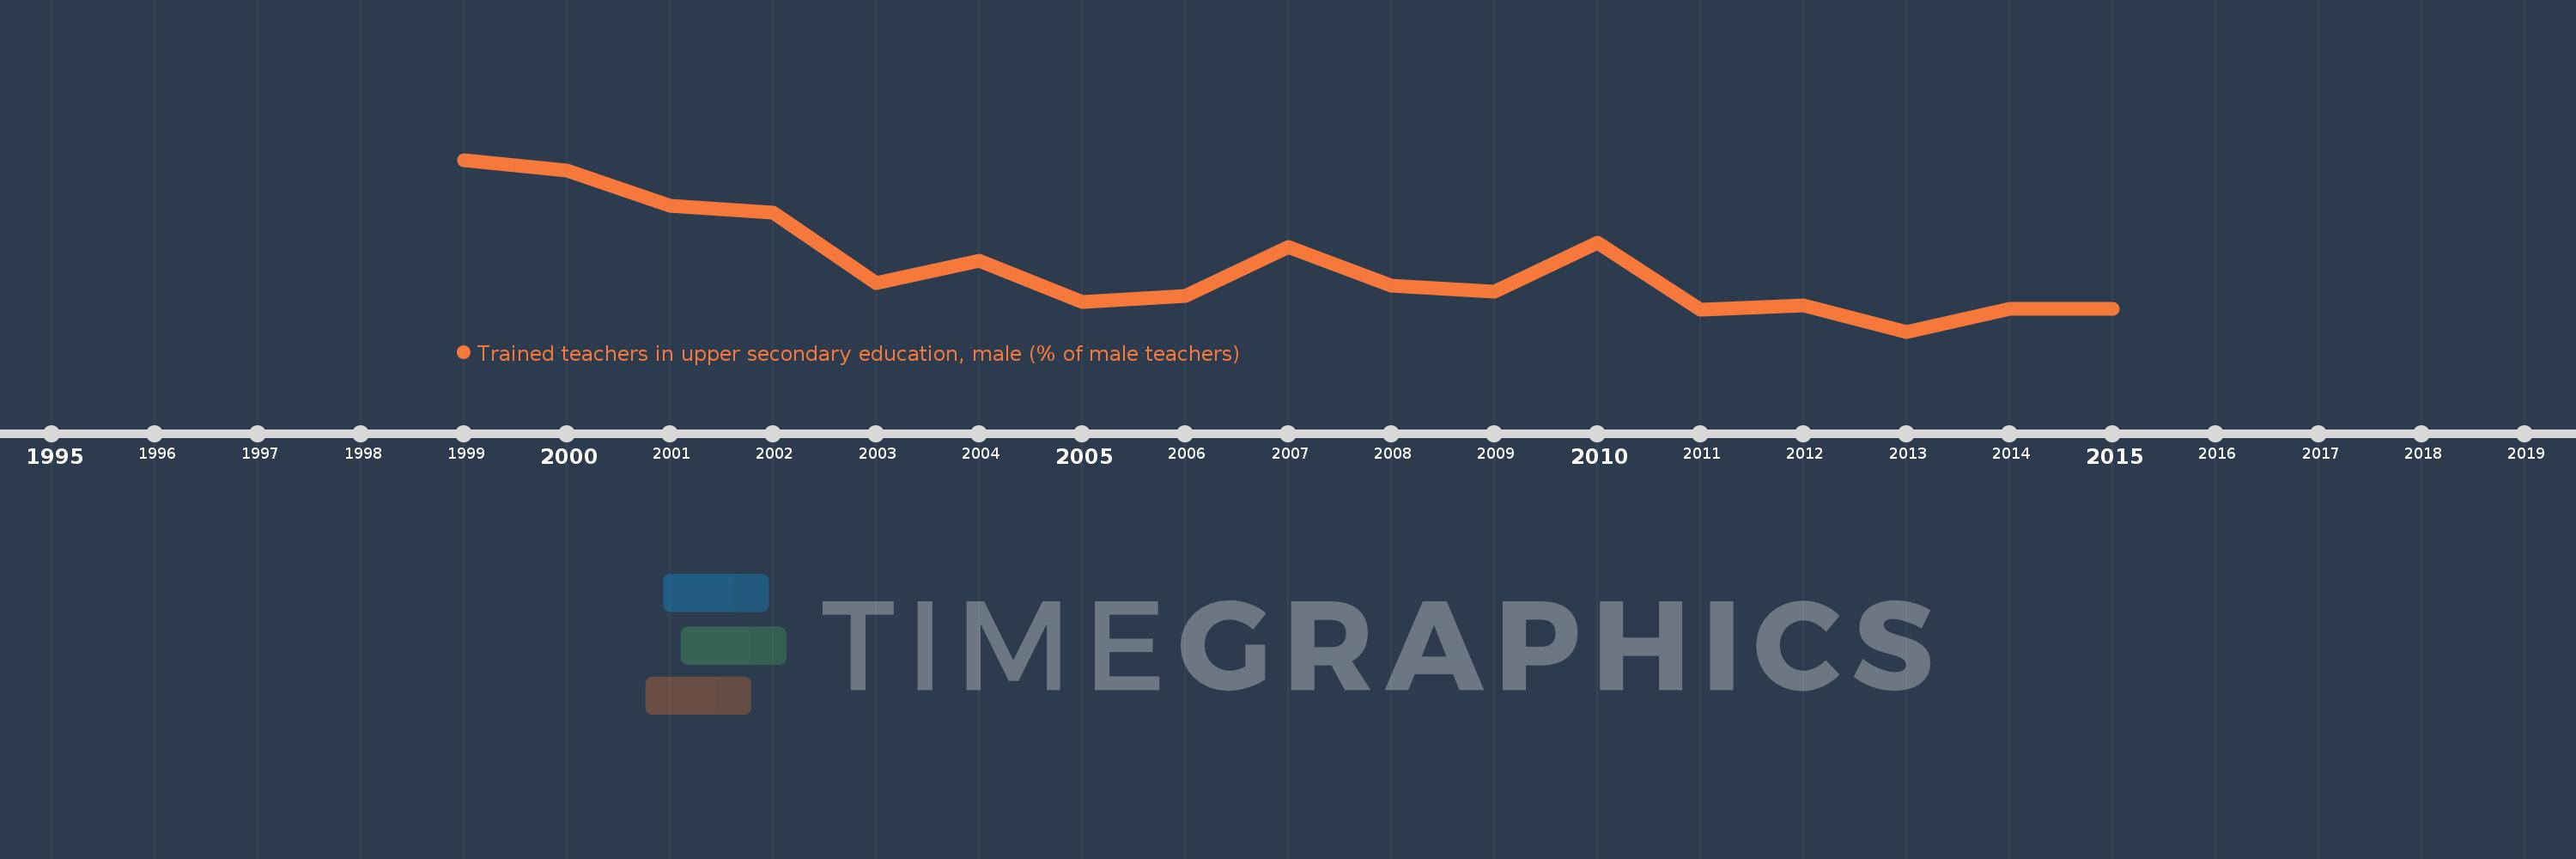
Trained teachers in upper secondary education, male (% of male teachers)
2015,2014,2013,2012,2011,2010,2009,2008,2007,2006,2005,2004,2003,2002,2001,2000,1999
Queste statistiche in altri paesi:
Linea del tempo:
Questa scala temporale mostra un grafico dal 1999 anno al 2015 anno. Least developed countries: UN classification. I dati fino ad 1998 anno non disponibili. Il numero di osservazioni attuali secondo i date: 17.
La fonte (nome):
Indicatori dello sviluppo mondiale
La fonte (organizzazione):
United Nations Educational, Scientific, and Cultural Organization (UNESCO) Institute for Statistics.
Categorie:
Education
sono stati aggiornati
23 apr 2017 anni
Indicatori delle variazioni dei valori per anni
Minima:
45.407
1 gen 2013 anni
Massimo:
56.336
1 gen 1999 anni
Alla data di osservazione
Valore
Variazione assoluta
La variazione rispetto al valore precedente
1 gen 1999 anni
56.336
+56.336
0.0%
1 gen 2000 anni
55.664
-0.672
-1.19%
1 gen 2001 anni
53.408
-2.256
-4.05%
1 gen 2002 anni
52.995
-0.413
-0.77%
1 gen 2003 anni
48.504
-4.491
-8.48%
1 gen 2004 anni
49.938
+1.434
2.96%
1 gen 2005 anni
47.271
-2.667
-5.34%
1 gen 2006 anni
47.696
+0.425
0.9%
1 gen 2007 anni
50.81
+3.114
6.53%
1 gen 2008 anni
48.309
-2.501
-4.92%
1 gen 2009 anni
47.948
-0.361
-0.75%
1 gen 2010 anni
51.044
+3.096
6.46%
1 gen 2011 anni
46.777
-4.267
-8.36%
1 gen 2012 anni
47.087
+0.31
0.66%
1 gen 2013 anni
45.407
-1.68
-3.57%
1 gen 2014 anni
46.847
+1.44
3.17%
1 gen 2015 anni
46.87
+0.023
0.05%
Classificazione dei paesi secondo i statistiche attuali per anni


Commenti: