29
/it/
it
AIzaSyAYiBZKx7MnpbEhh9jyipgxe19OcubqV5w
April 1, 2024
44563
Least developed countries: UN classification
LDC
false
2
1
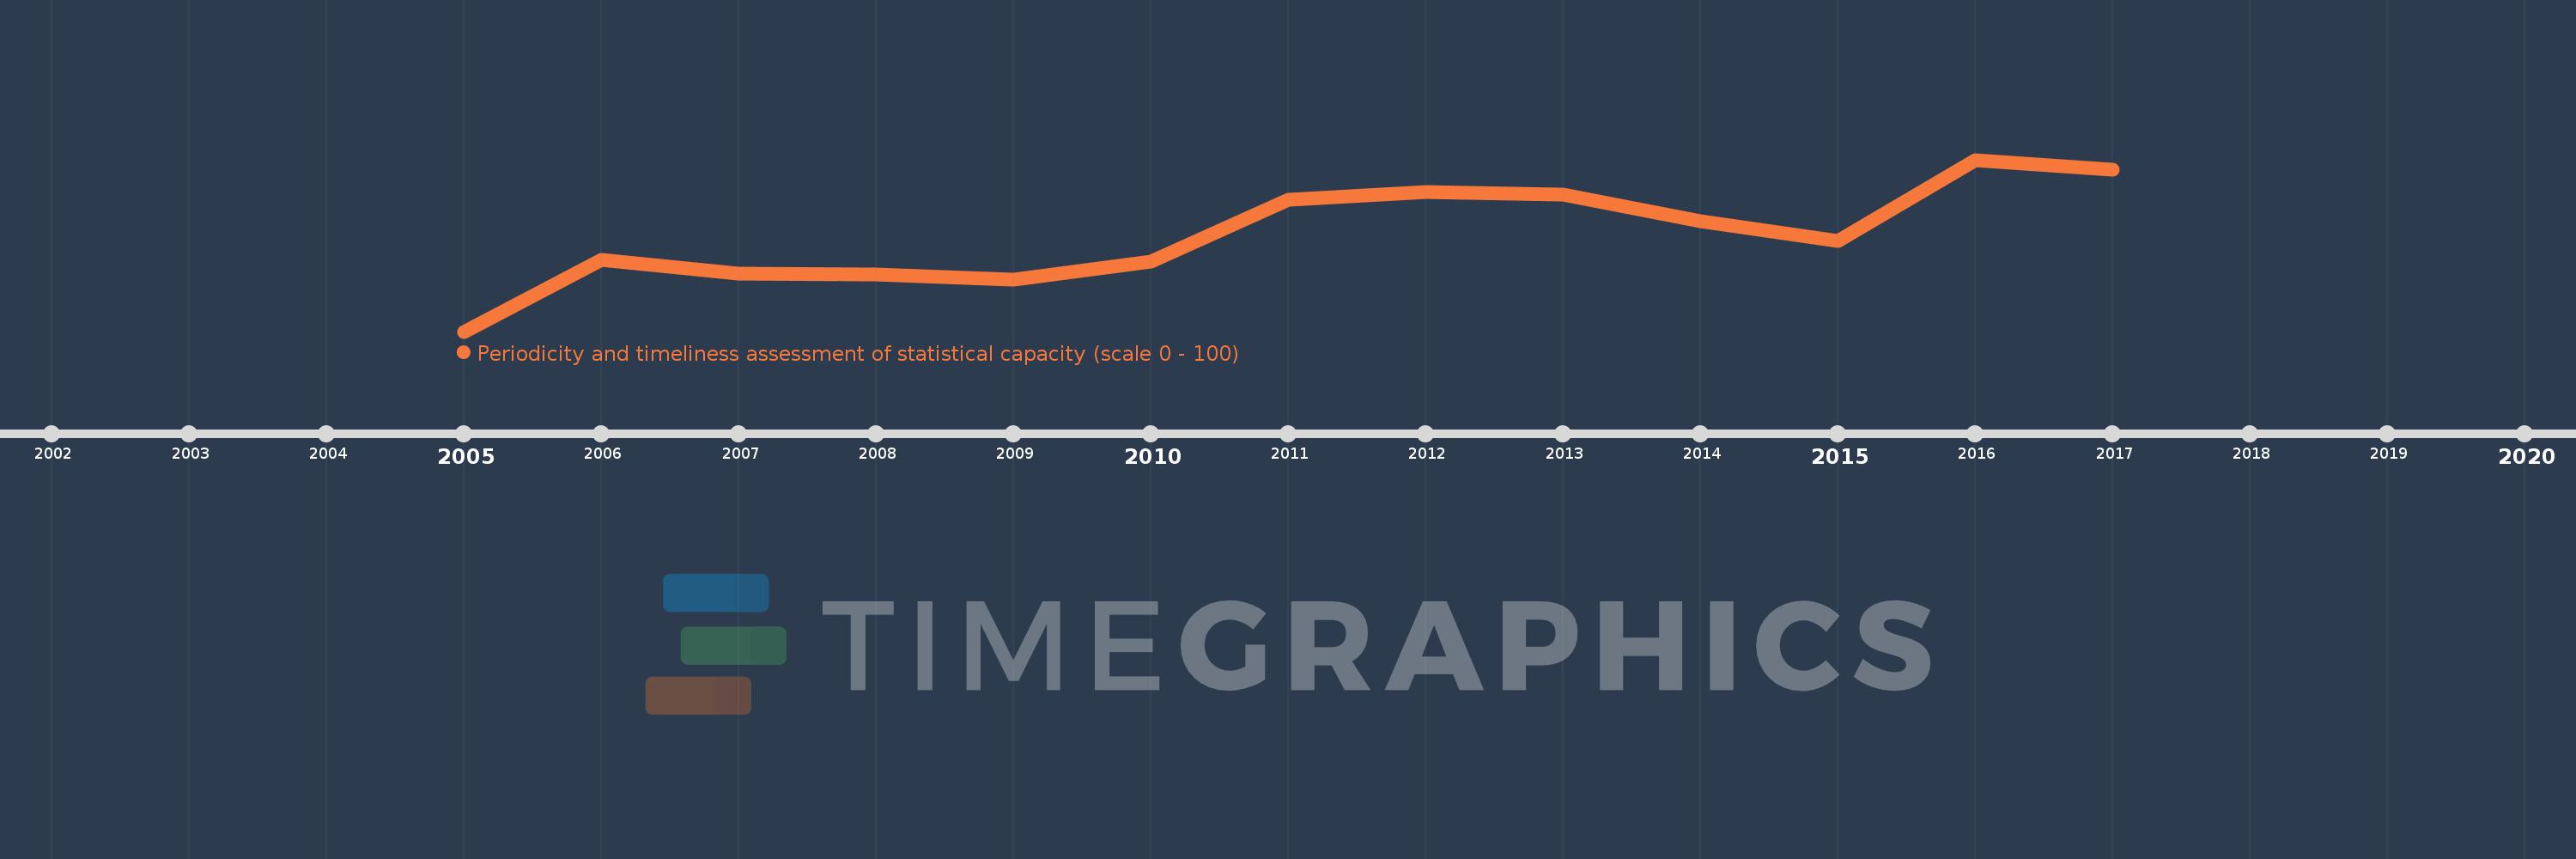
Periodicity and timeliness assessment of statistical capacity (scale 0 - 100)
2017,2016,2015,2014,2013,2012,2011,2010,2009,2008,2007,2006,2005
Queste statistiche in altri paesi:
Linea del tempo:
Questa scala temporale mostra un grafico dal 2005 anno al 2017 anno. Least developed countries: UN classification. I dati fino ad 2004 anno non disponibili. Il numero di osservazioni attuali secondo i date: 13.
La fonte (nome):
Indicatori dello sviluppo mondiale
La fonte (organizzazione):
World Bank
Categorie:
Public Sector
sono stati aggiornati
23 apr 2017 anni
Indicatori delle variazioni dei valori per anni
Minima:
75.946
1 gen 2005 anni
Massimo:
81.795
1 gen 2016 anni
Alla data di osservazione
Valore
Variazione assoluta
La variazione rispetto al valore precedente
1 gen 2005 anni
75.946
+75.946
0.0%
1 gen 2006 anni
78.378
+2.432
3.2%
1 gen 2007 anni
77.928
-0.45
-0.57%
1 gen 2008 anni
77.895
-0.033
-0.04%
1 gen 2009 anni
77.719
-0.175
-0.23%
1 gen 2010 anni
78.333
+0.614
0.79%
1 gen 2011 anni
80.439
+2.105
2.69%
1 gen 2012 anni
80.702
+0.263
0.33%
1 gen 2013 anni
80.614
-0.088
-0.11%
1 gen 2014 anni
79.701
-0.913
-1.13%
1 gen 2015 anni
79.017
-0.684
-0.86%
1 gen 2016 anni
81.795
+2.778
3.52%
1 gen 2017 anni
81.453
-0.342
-0.42%
Classificazione dei paesi secondo i statistiche attuali per anni


Commenti: