29
/it/
it
AIzaSyAYiBZKx7MnpbEhh9jyipgxe19OcubqV5w
April 1, 2024
42477
Latin America & Caribbean (excluding high income)
LAC
false
2
1
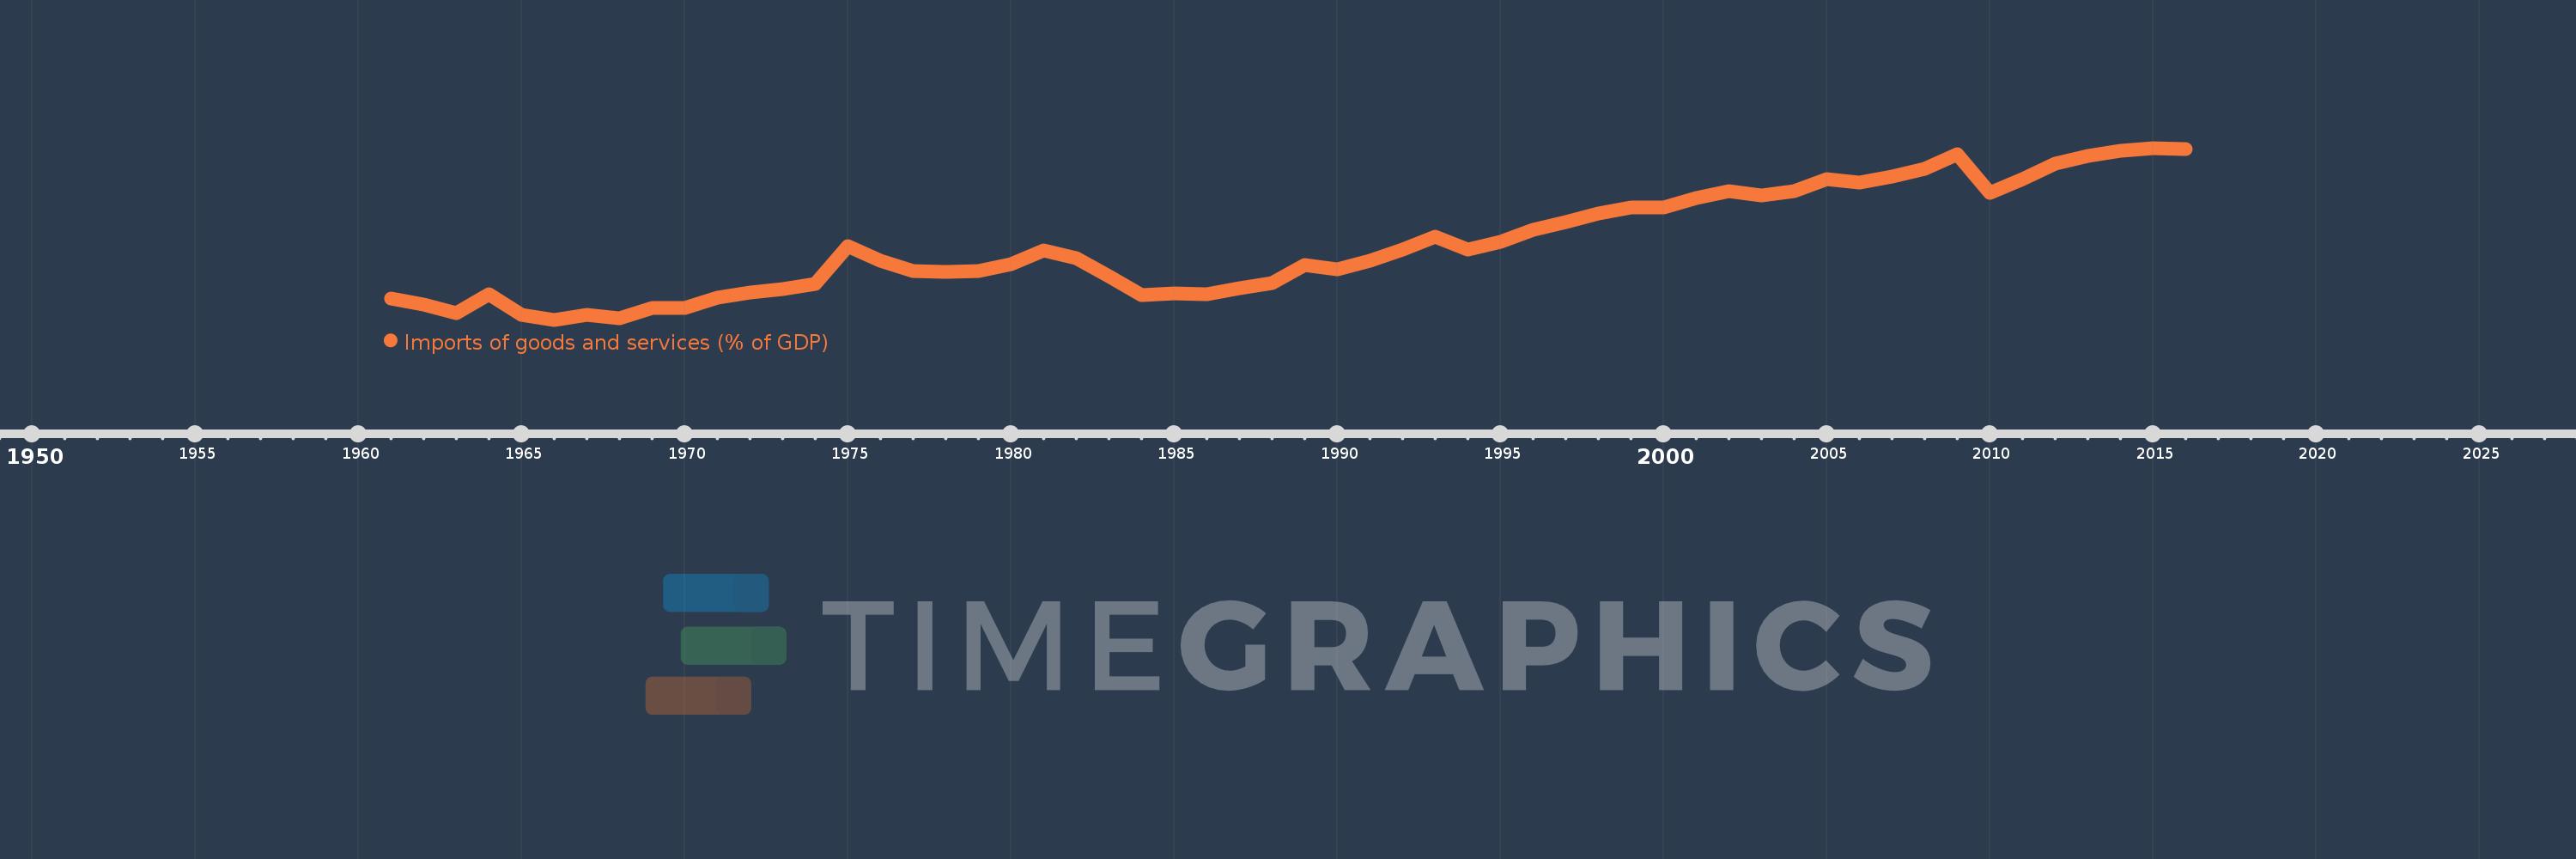
Imports of goods and services (% of GDP)
2016,2015,2014,2013,2012,2011,2010,2009,2008,2007,2006,2005,2004,2003,2002,2001,2000,1999,1998,1997,1996,1995,1994,1993,1992,1991,1990,1989,1988,1987,1986,1985,1984,1983,1982,1981,1980,1979,1978,1977,1976,1975,1974,1973,1972,1971,1970,1969,1968,1967,1966,1965,1964,1963,1962,1961
Queste statistiche in altri paesi:
AfghanistanAlbaniaAlgeriaAngolaAntigua and BarbudaArab WorldArgentinaArmeniaArubaAustraliaAustriaAzerbaijanBahamas, TheBahrainBangladeshBarbadosBelarusBelgiumBelizeBeninBermudaBhutanBoliviaBosnia and HerzegovinaBotswanaBrazilBrunei DarussalamBulgariaBurkina FasoBurundiCabo VerdeCambodiaCameroonCanadaCaribbean small statesCentral African RepublicCentral Europe and the BalticsChadChileChinaColombiaComorosCongo, Dem. Rep.Congo, Rep.Costa RicaCote d'IvoireCroatiaCubaCyprusCzech RepublicDenmarkDjiboutiDominicaDominican RepublicEarly-demographic dividendEast Asia & PacificEast Asia & Pacific (excluding high income)East Asia & Pacific (IDA & IBRD countries)EcuadorEgypt, Arab Rep.El SalvadorEquatorial GuineaEritreaEstoniaEthiopiaEuro areaEurope & Central AsiaEurope & Central Asia (excluding high income)Europe & Central Asia (IDA & IBRD countries)European UnionFaroe IslandsFijiFinlandFragile and conflict affected situationsFranceFrench PolynesiaGabonGambia, TheGeorgiaGermanyGhanaGreeceGrenadaGuatemalaGuineaGuinea-BissauGuyanaHaitiHeavily indebted poor countries (HIPC)High incomeHondurasHong Kong SAR, ChinaHungaryIBRD onlyIcelandIDA & IBRD totalIDA blendIDA onlyIDA totalIndiaIndonesiaIran, Islamic Rep.IraqIrelandIsraelItalyJamaicaJapanJordanKazakhstanKenyaKiribatiKorea, Rep.KosovoKuwaitKyrgyz RepublicLao PDRLate-demographic dividendLatin America & Caribbean Latin America & Caribbean (excluding high income)Latin America & the Caribbean (IDA & IBRD countries)LatviaLeast developed countries: UN classificationLebanonLesothoLiberiaLibyaLithuaniaLow & middle incomeLow incomeLower middle incomeLuxembourgMacao SAR, ChinaMacedonia, FYRMadagascarMalawiMalaysiaMaldivesMaliMaltaMauritaniaMauritiusMexicoMicronesia, Fed. Sts.Middle East & North AfricaMiddle East & North Africa (excluding high income)Middle East & North Africa (IDA & IBRD countries)Middle incomeMoldovaMongoliaMontenegroMoroccoMozambiqueMyanmarNamibiaNepalNetherlandsNew CaledoniaNew ZealandNicaraguaNigerNigeriaNorth AmericaNorwayOECD membersOmanOther small statesPacific island small statesPakistanPalauPanamaPapua New GuineaParaguayPeruPhilippinesPolandPortugalPost-demographic dividendPre-demographic dividendPuerto RicoQatarRomaniaRussian FederationRwandaSamoaSaudi ArabiaSenegalSerbiaSeychellesSierra LeoneSingaporeSlovak RepublicSloveniaSmall statesSolomon IslandsSomaliaSouth AfricaSouth AsiaSouth Asia (IDA & IBRD)South SudanSpainSri LankaSt. Kitts and NevisSt. LuciaSt. Vincent and the GrenadinesSub-Saharan Africa Sub-Saharan Africa (excluding high income)Sub-Saharan Africa (IDA & IBRD countries)SudanSurinameSwazilandSwedenSwitzerlandSyrian Arab RepublicTajikistanTanzaniaThailandTimor-LesteTogoTongaTrinidad and TobagoTunisiaTurkeyTurkmenistanUgandaUkraineUnited Arab EmiratesUnited KingdomUnited StatesUpper middle incomeUruguayUzbekistanVanuatuVenezuela, RBVietnamWest Bank and GazaWorldYemen, Rep.ZambiaZimbabwe Linea del tempo:
Questa scala temporale mostra un grafico dal 1961 anno al 2016 anno. Latin America & Caribbean (excluding high income). I dati fino ad 1960 anno non disponibili. Il numero di osservazioni attuali secondo i date: 56.
La fonte (nome):
Indicatori dello sviluppo mondiale
La fonte (organizzazione):
World Bank national accounts data, and OECD National Accounts data files.
Categorie:
Economy & Growth, Trade
sono stati aggiornati
23 apr 2017 anni
Indicatori delle variazioni dei valori per anni
Minima:
9.293
1 gen 1966 anni
Massimo:
22.477
1 gen 2015 anni
Alla data di osservazione
Valore
Variazione assoluta
La variazione rispetto al valore precedente
1 gen 1961 anni
10.91
+10.91
0.0%
1 gen 1962 anni
10.483
-0.426
-3.91%
1 gen 1963 anni
9.773
-0.71
-6.77%
1 gen 1964 anni
11.265
+1.491
15.26%
1 gen 1965 anni
9.686
-1.579
-14.02%
1 gen 1966 anni
9.293
-0.392
-4.05%
1 gen 1967 anni
9.644
+0.351
3.78%
1 gen 1968 anni
9.41
-0.234
-2.43%
1 gen 1969 anni
10.205
+0.795
8.44%
1 gen 1970 anni
10.17
-0.035
-0.34%
1 gen 1971 anni
10.995
+0.826
8.12%
1 gen 1972 anni
11.362
+0.366
3.33%
1 gen 1973 anni
11.643
+0.281
2.48%
1 gen 1974 anni
12.012
+0.369
3.17%
1 gen 1975 anni
14.975
+2.963
24.66%
1 gen 1976 anni
13.832
-1.143
-7.63%
1 gen 1977 anni
13.043
-0.789
-5.7%
1 gen 1978 anni
12.96
-0.083
-0.64%
1 gen 1979 anni
13.031
+0.071
0.55%
1 gen 1980 anni
13.529
+0.498
3.82%
1 gen 1981 anni
14.637
+1.108
8.19%
1 gen 1982 anni
14.052
-0.585
-4.0%
1 gen 1983 anni
12.605
-1.447
-10.3%
1 gen 1984 anni
11.197
-1.407
-11.17%
1 gen 1985 anni
11.284
+0.087
0.78%
1 gen 1986 anni
11.278
-0.007
-0.06%
1 gen 1987 anni
11.705
+0.427
3.79%
1 gen 1988 anni
12.131
+0.426
3.64%
1 gen 1989 anni
13.521
+1.39
11.46%
1 gen 1990 anni
13.134
-0.387
-2.86%
1 gen 1991 anni
13.804
+0.67
5.1%
1 gen 1992 anni
14.707
+0.903
6.54%
1 gen 1993 anni
15.645
+0.939
6.38%
1 gen 1994 anni
14.672
-0.973
-6.22%
1 gen 1995 anni
15.258
+0.586
3.99%
1 gen 1996 anni
16.227
+0.969
6.35%
1 gen 1997 anni
16.784
+0.557
3.43%
1 gen 1998 anni
17.448
+0.664
3.96%
1 gen 1999 anni
17.92
+0.472
2.7%
1 gen 2000 anni
17.889
-0.031
-0.17%
1 gen 2001 anni
18.645
+0.756
4.23%
1 gen 2002 anni
19.134
+0.489
2.63%
1 gen 2003 anni
18.808
-0.326
-1.7%
1 gen 2004 anni
19.14
+0.331
1.76%
1 gen 2005 anni
20.066
+0.926
4.84%
1 gen 2006 anni
19.799
-0.267
-1.33%
1 gen 2007 anni
20.259
+0.461
2.33%
1 gen 2008 anni
20.867
+0.607
3.0%
1 gen 2009 anni
21.973
+1.107
5.3%
1 gen 2010 anni
19.013
-2.96
-13.47%
1 gen 2011 anni
20.094
+1.081
5.68%
1 gen 2012 anni
21.262
+1.168
5.81%
1 gen 2013 anni
21.875
+0.613
2.88%
1 gen 2014 anni
22.28
+0.405
1.85%
1 gen 2015 anni
22.477
+0.197
0.89%
1 gen 2016 anni
22.371
-0.107
-0.47%
Classificazione dei paesi secondo i statistiche attuali per anni


Commenti: