29
/it/
it
AIzaSyAYiBZKx7MnpbEhh9jyipgxe19OcubqV5w
April 1, 2024
41358
Latin America & Caribbean
LCN
false
2
1
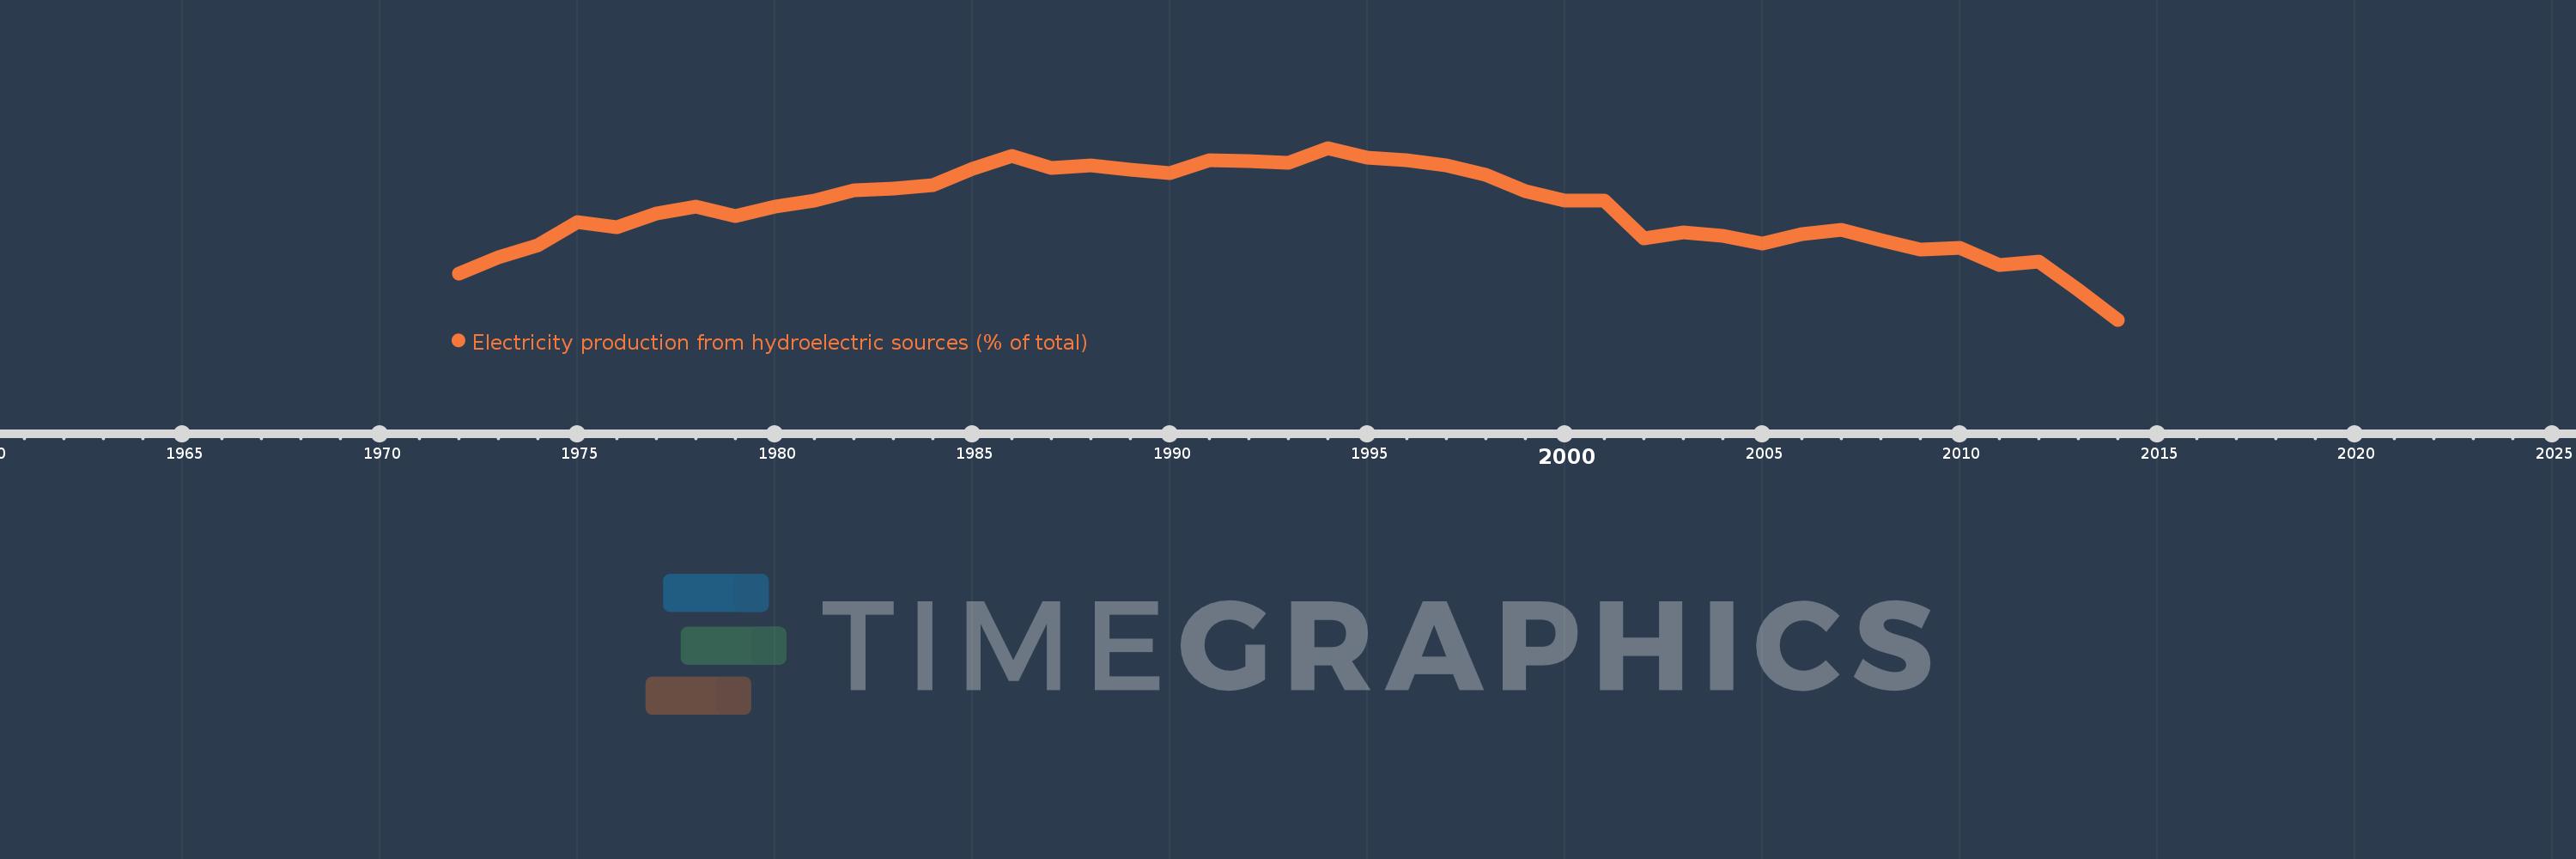
Electricity production from hydroelectric sources (% of total)
2014,2013,2012,2011,2010,2009,2008,2007,2006,2005,2004,2003,2002,2001,2000,1999,1998,1997,1996,1995,1994,1993,1992,1991,1990,1989,1988,1987,1986,1985,1984,1983,1982,1981,1980,1979,1978,1977,1976,1975,1974,1973,1972
Queste statistiche in altri paesi:
AlbaniaAlgeriaAngolaArab WorldArgentinaArmeniaAustraliaAustriaAzerbaijanBahrainBangladeshBelarusBelgiumBeninBoliviaBosnia and HerzegovinaBotswanaBrazilBrunei DarussalamBulgariaCambodiaCameroonCanadaCentral Europe and the BalticsChileChinaColombiaCongo, Dem. Rep.Congo, Rep.Costa RicaCote d'IvoireCroatiaCubaCuracaoCyprusCzech RepublicDenmarkDominican RepublicEarly-demographic dividendEast Asia & PacificEast Asia & Pacific (excluding high income)East Asia & Pacific (IDA & IBRD countries)EcuadorEgypt, Arab Rep.El SalvadorEritreaEstoniaEthiopiaEuro areaEurope & Central AsiaEurope & Central Asia (excluding high income)Europe & Central Asia (IDA & IBRD countries)European UnionFinlandFragile and conflict affected situationsFranceGabonGeorgiaGermanyGhanaGibraltarGreeceGuatemalaHaitiHeavily indebted poor countries (HIPC)High incomeHondurasHong Kong SAR, ChinaHungaryIBRD onlyIcelandIDA & IBRD totalIDA blendIDA onlyIDA totalIndiaIndonesiaIran, Islamic Rep.IraqIrelandIsraelItalyJamaicaJapanJordanKazakhstanKenyaKorea, Dem. People’s Rep.Korea, Rep.KosovoKuwaitKyrgyz RepublicLate-demographic dividendLatin America & Caribbean Latin America & Caribbean (excluding high income)Latin America & the Caribbean (IDA & IBRD countries)LatviaLeast developed countries: UN classificationLebanonLibyaLithuaniaLow & middle incomeLower middle incomeLuxembourgMacedonia, FYRMalaysiaMaltaMauritiusMexicoMiddle East & North AfricaMiddle East & North Africa (excluding high income)Middle East & North Africa (IDA & IBRD countries)Middle incomeMoldovaMongoliaMontenegroMoroccoMozambiqueMyanmarNamibiaNepalNetherlandsNew ZealandNicaraguaNigerNigeriaNorth AmericaNorwayOECD membersOmanOther small statesPakistanPanamaParaguayPeruPhilippinesPolandPortugalPost-demographic dividendPre-demographic dividendQatarRomaniaRussian FederationSaudi ArabiaSenegalSerbiaSingaporeSlovak RepublicSloveniaSmall statesSouth AfricaSouth AsiaSouth Asia (IDA & IBRD)South SudanSpainSri LankaSub-Saharan Africa Sub-Saharan Africa (excluding high income)Sub-Saharan Africa (IDA & IBRD countries)SudanSwedenSwitzerlandSyrian Arab RepublicTajikistanTanzaniaThailandTogoTrinidad and TobagoTunisiaTurkeyTurkmenistanUkraineUnited Arab EmiratesUnited KingdomUnited StatesUpper middle incomeUruguayUzbekistanVenezuela, RBVietnamWorldYemen, Rep.ZambiaZimbabwe Linea del tempo:
Questa scala temporale mostra un grafico dal 1972 anno al 2014 anno. Latin America & Caribbean . I dati fino ad 1971 anno non disponibili. Il numero di osservazioni attuali secondo i date: 43.
La fonte (nome):
Indicatori dello sviluppo mondiale
La fonte (organizzazione):
IEA Statistics © OECD/IEA 2014 (http://www.iea.org/stats/index.asp), subject to https://www.iea.org/t&c/termsandconditions/
Categorie:
Energy & Mining, Climate Change, Infrastructure
sono stati aggiornati
23 apr 2017 anni
Indicatori delle variazioni dei valori per anni
Minima:
47.078
1 gen 2014 anni
Massimo:
63.947
1 gen 1994 anni
Alla data di osservazione
Valore
Variazione assoluta
La variazione rispetto al valore precedente
1 gen 1972 anni
51.576
+51.576
0.0%
1 gen 1973 anni
53.199
+1.623
3.15%
1 gen 1974 anni
54.401
+1.201
2.26%
1 gen 1975 anni
56.705
+2.304
4.23%
1 gen 1976 anni
56.134
-0.571
-1.01%
1 gen 1977 anni
57.504
+1.37
2.44%
1 gen 1978 anni
58.151
+0.647
1.13%
1 gen 1979 anni
57.22
-0.931
-1.6%
1 gen 1980 anni
58.148
+0.928
1.62%
1 gen 1981 anni
58.8
+0.652
1.12%
1 gen 1982 anni
59.79
+0.991
1.68%
1 gen 1983 anni
59.973
+0.183
0.31%
1 gen 1984 anni
60.295
+0.322
0.54%
1 gen 1985 anni
61.91
+1.614
2.68%
1 gen 1986 anni
63.151
+1.242
2.01%
1 gen 1987 anni
62.014
-1.137
-1.8%
1 gen 1988 anni
62.24
+0.226
0.36%
1 gen 1989 anni
61.823
-0.416
-0.67%
1 gen 1990 anni
61.506
-0.318
-0.51%
1 gen 1991 anni
62.715
+1.209
1.97%
1 gen 1992 anni
62.625
-0.089
-0.14%
1 gen 1993 anni
62.448
-0.178
-0.28%
1 gen 1994 anni
63.947
+1.499
2.4%
1 gen 1995 anni
63.012
-0.935
-1.46%
1 gen 1996 anni
62.748
-0.264
-0.42%
1 gen 1997 anni
62.193
-0.555
-0.88%
1 gen 1998 anni
61.305
-0.889
-1.43%
1 gen 1999 anni
59.671
-1.633
-2.66%
1 gen 2000 anni
58.796
-0.875
-1.47%
1 gen 2001 anni
58.78
-0.016
-0.03%
1 gen 2002 anni
55.071
-3.709
-6.31%
1 gen 2003 anni
55.621
+0.549
1.0%
1 gen 2004 anni
55.31
-0.311
-0.56%
1 gen 2005 anni
54.57
-0.74
-1.34%
1 gen 2006 anni
55.447
+0.877
1.61%
1 gen 2007 anni
55.917
+0.47
0.85%
1 gen 2008 anni
54.874
-1.043
-1.87%
1 gen 2009 anni
53.992
-0.882
-1.61%
1 gen 2010 anni
54.099
+0.107
0.2%
1 gen 2011 anni
52.41
-1.689
-3.12%
1 gen 2012 anni
52.83
+0.419
0.8%
1 gen 2013 anni
50.013
-2.817
-5.33%
1 gen 2014 anni
47.078
-2.935
-5.87%
Classificazione dei paesi secondo i statistiche attuali per anni


Commenti: