Download Queste statistiche in altri paesi:
Linea del tempo:
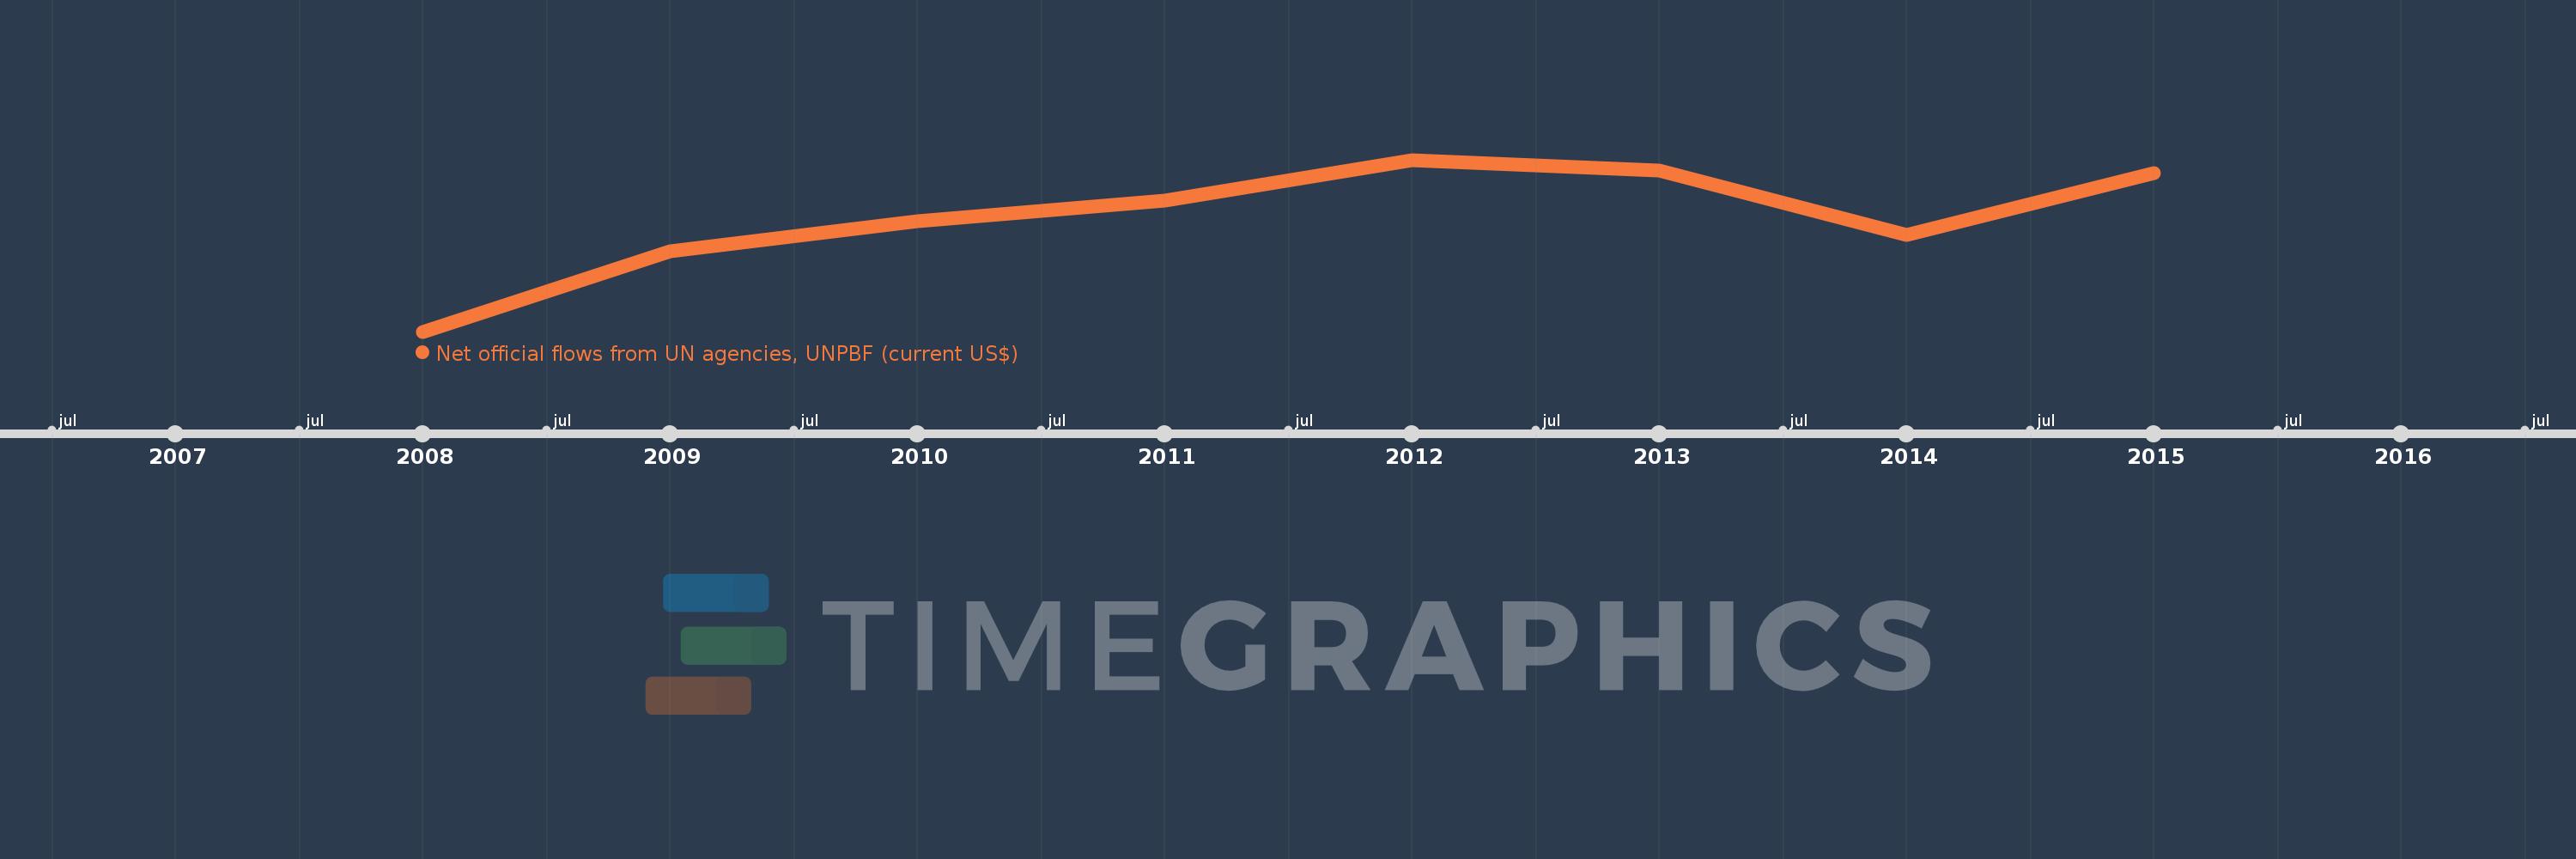
Questa scala temporale mostra un grafico dal 2008 anno al 2015 anno. IDA only. I dati fino ad 2007 anno non disponibili. Il numero di osservazioni attuali secondo i date: 8.
La fonte (nome):
Indicatori dello sviluppo mondiale
La fonte (organizzazione):
Development Assistance Committee of the Organisation for Economic Co-operation and Development, Geographical Distribution of Financial Flows to Developing Countries, Development Co-operation Report, and International Development Statistics database. Data are available online at: www.oecd.org/dac/stats/idsonline.
Categorie:
Aid Effectiveness
sono stati aggiornati
23 apr 2017 anni
Indicatori delle variazioni dei valori per anni
Minima:
9.55 Mln
1 gen 2008 anni
Massimo:
60.63 Mln
1 gen 2012 anni
Alla data di osservazione
Valore
Variazione assoluta
La variazione rispetto al valore precedente
1 gen 2008 anni
9.55 Mln
+9.55 Mln
0.0%
1 gen 2009 anni
33.48 Mln
+23.93 Mln
250.58%
1 gen 2010 anni
42.43 Mln
+8.95 Mln
26.73%
1 gen 2011 anni
48.38 Mln
+5.95 Mln
14.02%
1 gen 2012 anni
60.63 Mln
+12.25 Mln
25.32%
1 gen 2013 anni
57.33 Mln
-3.3 Mln
-5.44%
1 gen 2014 anni
38.34 Mln
-18.99 Mln
-33.12%
1 gen 2015 anni
56.68 Mln
+18.34 Mln
47.84%
Classificazione dei paesi secondo i statistiche attuali per anni
