29
/it/
it
AIzaSyAYiBZKx7MnpbEhh9jyipgxe19OcubqV5w
April 1, 2024
38919
IDA only
IDX
false
2
1
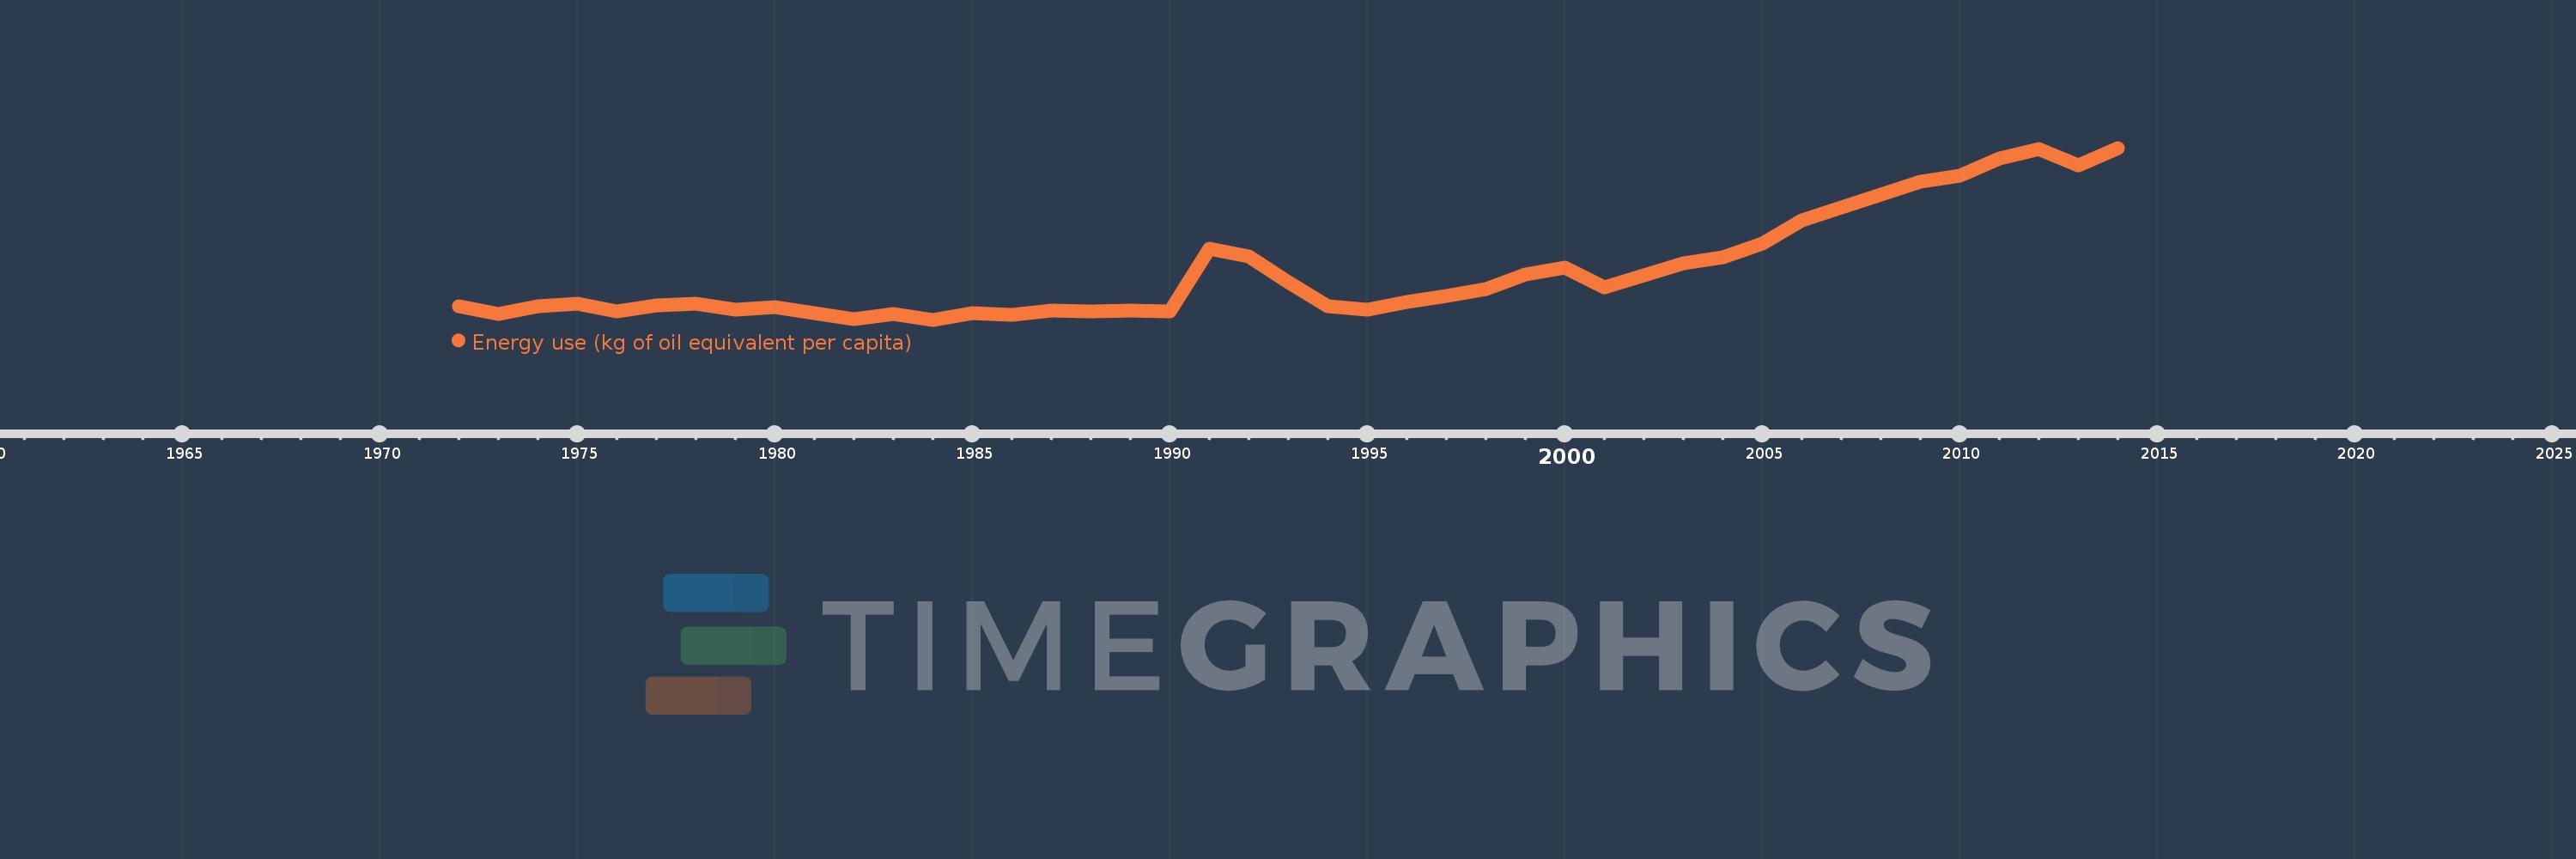
Energy use (kg of oil equivalent per capita)
2014,2013,2012,2011,2010,2009,2008,2007,2006,2005,2004,2003,2002,2001,2000,1999,1998,1997,1996,1995,1994,1993,1992,1991,1990,1989,1988,1987,1986,1985,1984,1983,1982,1981,1980,1979,1978,1977,1976,1975,1974,1973,1972
Queste statistiche in altri paesi:
AlbaniaAlgeriaAngolaAntigua and BarbudaArab WorldArgentinaArmeniaAustraliaAustriaAzerbaijanBahamas, TheBahrainBangladeshBarbadosBelarusBelgiumBelizeBeninBhutanBoliviaBosnia and HerzegovinaBotswanaBrazilBrunei DarussalamBulgariaCabo VerdeCambodiaCameroonCanadaCaribbean small statesCentral Europe and the BalticsChileChinaColombiaComorosCongo, Dem. Rep.Congo, Rep.Costa RicaCote d'IvoireCroatiaCubaCuracaoCyprusCzech RepublicDenmarkDjiboutiDominicaDominican RepublicEarly-demographic dividendEast Asia & PacificEast Asia & Pacific (excluding high income)East Asia & Pacific (IDA & IBRD countries)EcuadorEgypt, Arab Rep.El SalvadorEquatorial GuineaEritreaEstoniaEthiopiaEuro areaEurope & Central AsiaEurope & Central Asia (excluding high income)Europe & Central Asia (IDA & IBRD countries)European UnionFijiFinlandFragile and conflict affected situationsFranceGabonGambia, TheGeorgiaGermanyGhanaGibraltarGreeceGrenadaGuatemalaGuinea-BissauGuyanaHaitiHeavily indebted poor countries (HIPC)High incomeHondurasHong Kong SAR, ChinaHungaryIBRD onlyIcelandIDA & IBRD totalIDA blendIDA onlyIDA totalIndiaIndonesiaIran, Islamic Rep.IraqIrelandIsraelItalyJamaicaJapanJordanKazakhstanKenyaKiribatiKorea, Dem. People’s Rep.Korea, Rep.KosovoKuwaitKyrgyz RepublicLate-demographic dividendLatin America & Caribbean Latin America & Caribbean (excluding high income)Latin America & the Caribbean (IDA & IBRD countries)LatviaLeast developed countries: UN classificationLebanonLesothoLibyaLithuaniaLow & middle incomeLower middle incomeLuxembourgMacedonia, FYRMalaysiaMaldivesMaltaMarshall IslandsMauritiusMexicoMiddle East & North AfricaMiddle East & North Africa (excluding high income)Middle East & North Africa (IDA & IBRD countries)Middle incomeMoldovaMongoliaMontenegroMoroccoMozambiqueMyanmarNamibiaNepalNetherlandsNew ZealandNicaraguaNigerNigeriaNorth AmericaNorwayOECD membersOmanOther small statesPacific island small statesPakistanPalauPanamaParaguayPeruPhilippinesPolandPortugalPost-demographic dividendPre-demographic dividendQatarRomaniaRussian FederationSamoaSao Tome and PrincipeSaudi ArabiaSenegalSerbiaSeychellesSingaporeSlovak RepublicSloveniaSmall statesSolomon IslandsSouth AfricaSouth AsiaSouth Asia (IDA & IBRD)South SudanSpainSri LankaSt. Kitts and NevisSt. LuciaSt. Vincent and the GrenadinesSub-Saharan Africa Sub-Saharan Africa (excluding high income)Sub-Saharan Africa (IDA & IBRD countries)SudanSurinameSwazilandSwedenSwitzerlandSyrian Arab RepublicTajikistanTanzaniaThailandTimor-LesteTogoTongaTrinidad and TobagoTunisiaTurkeyTurkmenistanUkraineUnited Arab EmiratesUnited KingdomUnited StatesUpper middle incomeUruguayUzbekistanVanuatuVenezuela, RBVietnamWorldYemen, Rep.ZambiaZimbabwe Linea del tempo:
Questa scala temporale mostra un grafico dal 1972 anno al 2014 anno. IDA only. I dati fino ad 1971 anno non disponibili. Il numero di osservazioni attuali secondo i date: 43.
La fonte (nome):
Indicatori dello sviluppo mondiale
La fonte (organizzazione):
IEA Statistics © OECD/IEA 2014 (http://www.iea.org/stats/index.asp), subject to https://www.iea.org/t&c/termsandconditions/
Categorie:
Energy & Mining, Climate Change
sono stati aggiornati
23 apr 2017 anni
Indicatori delle variazioni dei valori per anni
Minima:
315.573
1 gen 1984 anni
Massimo:
373.071
1 gen 2014 anni
Alla data di osservazione
Valore
Variazione assoluta
La variazione rispetto al valore precedente
1 gen 1972 anni
319.99
+319.99
0.0%
1 gen 1973 anni
317.386
-2.605
-0.81%
1 gen 1974 anni
319.944
+2.559
0.81%
1 gen 1975 anni
320.947
+1.002
0.31%
1 gen 1976 anni
318.33
-2.617
-0.82%
1 gen 1977 anni
320.503
+2.173
0.68%
1 gen 1978 anni
320.98
+0.477
0.15%
1 gen 1979 anni
318.844
-2.136
-0.67%
1 gen 1980 anni
319.885
+1.041
0.33%
1 gen 1981 anni
317.895
-1.99
-0.62%
1 gen 1982 anni
315.696
-2.199
-0.69%
1 gen 1983 anni
317.393
+1.697
0.54%
1 gen 1984 anni
315.573
-1.821
-0.57%
1 gen 1985 anni
317.921
+2.348
0.74%
1 gen 1986 anni
317.233
-0.688
-0.22%
1 gen 1987 anni
318.604
+1.371
0.43%
1 gen 1988 anni
318.292
-0.312
-0.1%
1 gen 1989 anni
318.766
+0.474
0.15%
1 gen 1990 anni
318.247
-0.519
-0.16%
1 gen 1991 anni
339.487
+21.24
6.67%
1 gen 1992 anni
336.727
-2.76
-0.81%
1 gen 1993 anni
328.033
-8.694
-2.58%
1 gen 1994 anni
320.077
-7.957
-2.43%
1 gen 1995 anni
318.8
-1.276
-0.4%
1 gen 1996 anni
321.405
+2.604
0.82%
1 gen 1997 anni
323.645
+2.241
0.7%
1 gen 1998 anni
325.798
+2.153
0.67%
1 gen 1999 anni
330.63
+4.832
1.48%
1 gen 2000 anni
332.889
+2.258
0.68%
1 gen 2001 anni
326.398
-6.491
-1.95%
1 gen 2002 anni
330.373
+3.975
1.22%
1 gen 2003 anni
334.408
+4.035
1.22%
1 gen 2004 anni
336.559
+2.151
0.64%
1 gen 2005 anni
341.123
+4.564
1.36%
1 gen 2006 anni
348.836
+7.713
2.26%
1 gen 2007 anni
353.204
+4.368
1.25%
1 gen 2008 anni
357.55
+4.346
1.23%
1 gen 2009 anni
361.818
+4.268
1.19%
1 gen 2010 anni
363.721
+1.903
0.53%
1 gen 2011 anni
369.516
+5.795
1.59%
1 gen 2012 anni
372.828
+3.311
0.9%
1 gen 2013 anni
367.246
-5.582
-1.5%
1 gen 2014 anni
373.071
+5.826
1.59%
Classificazione dei paesi secondo i statistiche attuali per anni


Commenti: