29
/it/
it
AIzaSyAYiBZKx7MnpbEhh9jyipgxe19OcubqV5w
April 1, 2024
38543
IDA blend
IDB
false
2
1
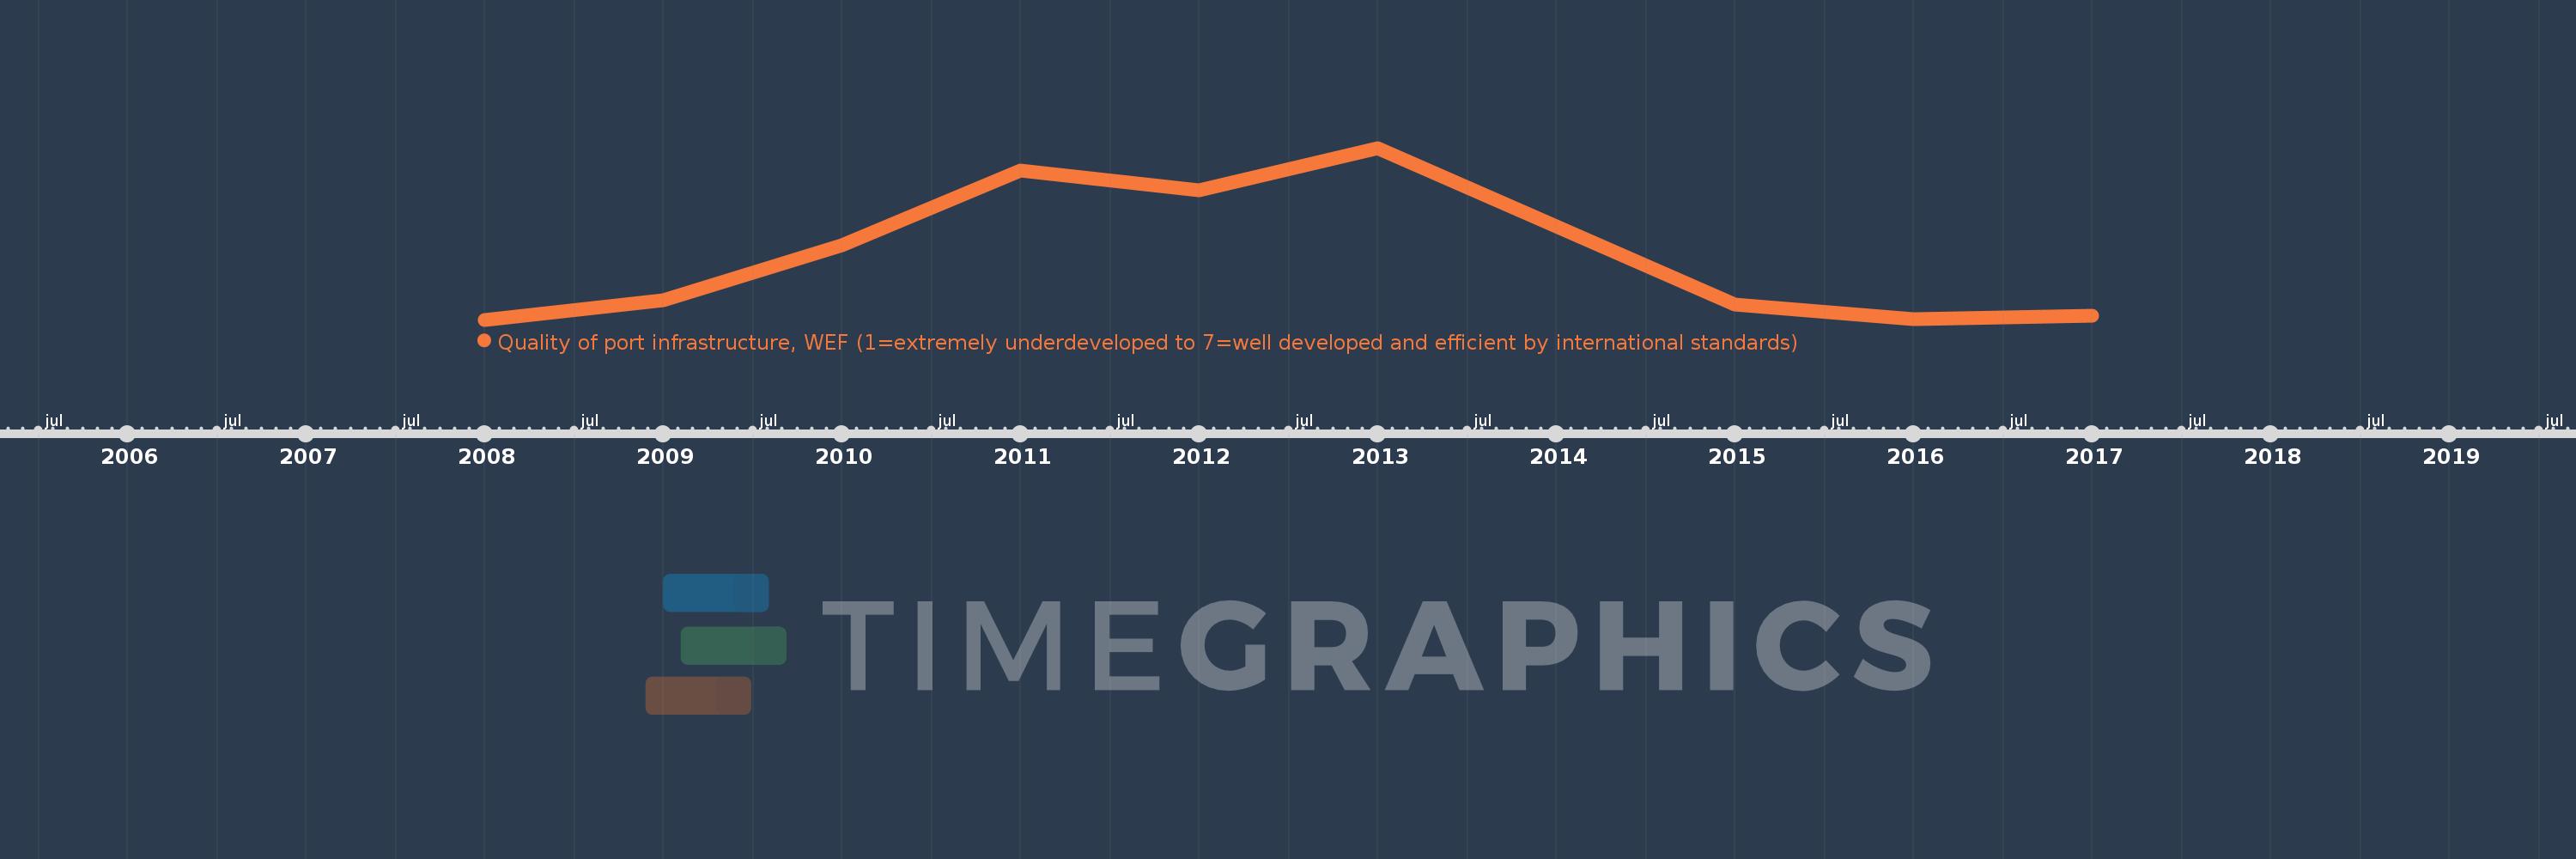
Quality of port infrastructure, WEF (1=extremely underdeveloped to 7=well developed and efficient by international standards)
2017,2016,2015,2014,2013,2012,2011,2010,2009,2008
Queste statistiche in altri paesi:
Linea del tempo:
Questa scala temporale mostra un grafico dal 2008 anno al 2017 anno. IDA blend. I dati fino ad 2007 anno non disponibili. Il numero di osservazioni attuali secondo i date: 10.
La fonte (nome):
Indicatori dello sviluppo mondiale
La fonte (organizzazione):
World Economic Forum, Global Competiveness Report.
Categorie:
Infrastructure
sono stati aggiornati
23 apr 2017 anni
Indicatori delle variazioni dei valori per anni
Minima:
3.107
1 gen 2008 anni
Massimo:
3.664
1 gen 2013 anni
Alla data di osservazione
Valore
Variazione assoluta
La variazione rispetto al valore precedente
1 gen 2008 anni
3.107
+3.107
0.0%
1 gen 2009 anni
3.171
+0.064
2.05%
1 gen 2010 anni
3.348
+0.177
5.59%
1 gen 2011 anni
3.591
+0.243
7.25%
1 gen 2012 anni
3.527
-0.064
-1.77%
1 gen 2013 anni
3.664
+0.136
3.87%
1 gen 2014 anni
3.409
-0.255
-6.95%
1 gen 2015 anni
3.155
-0.255
-7.47%
1 gen 2016 anni
3.11
-0.045
-1.41%
1 gen 2017 anni
3.12
+0.01
0.32%
Classificazione dei paesi secondo i statistiche attuali per anni


Commenti: