29
/it/
it
AIzaSyAYiBZKx7MnpbEhh9jyipgxe19OcubqV5w
April 1, 2024
37754
IDA & IBRD total
IBT
false
2
1
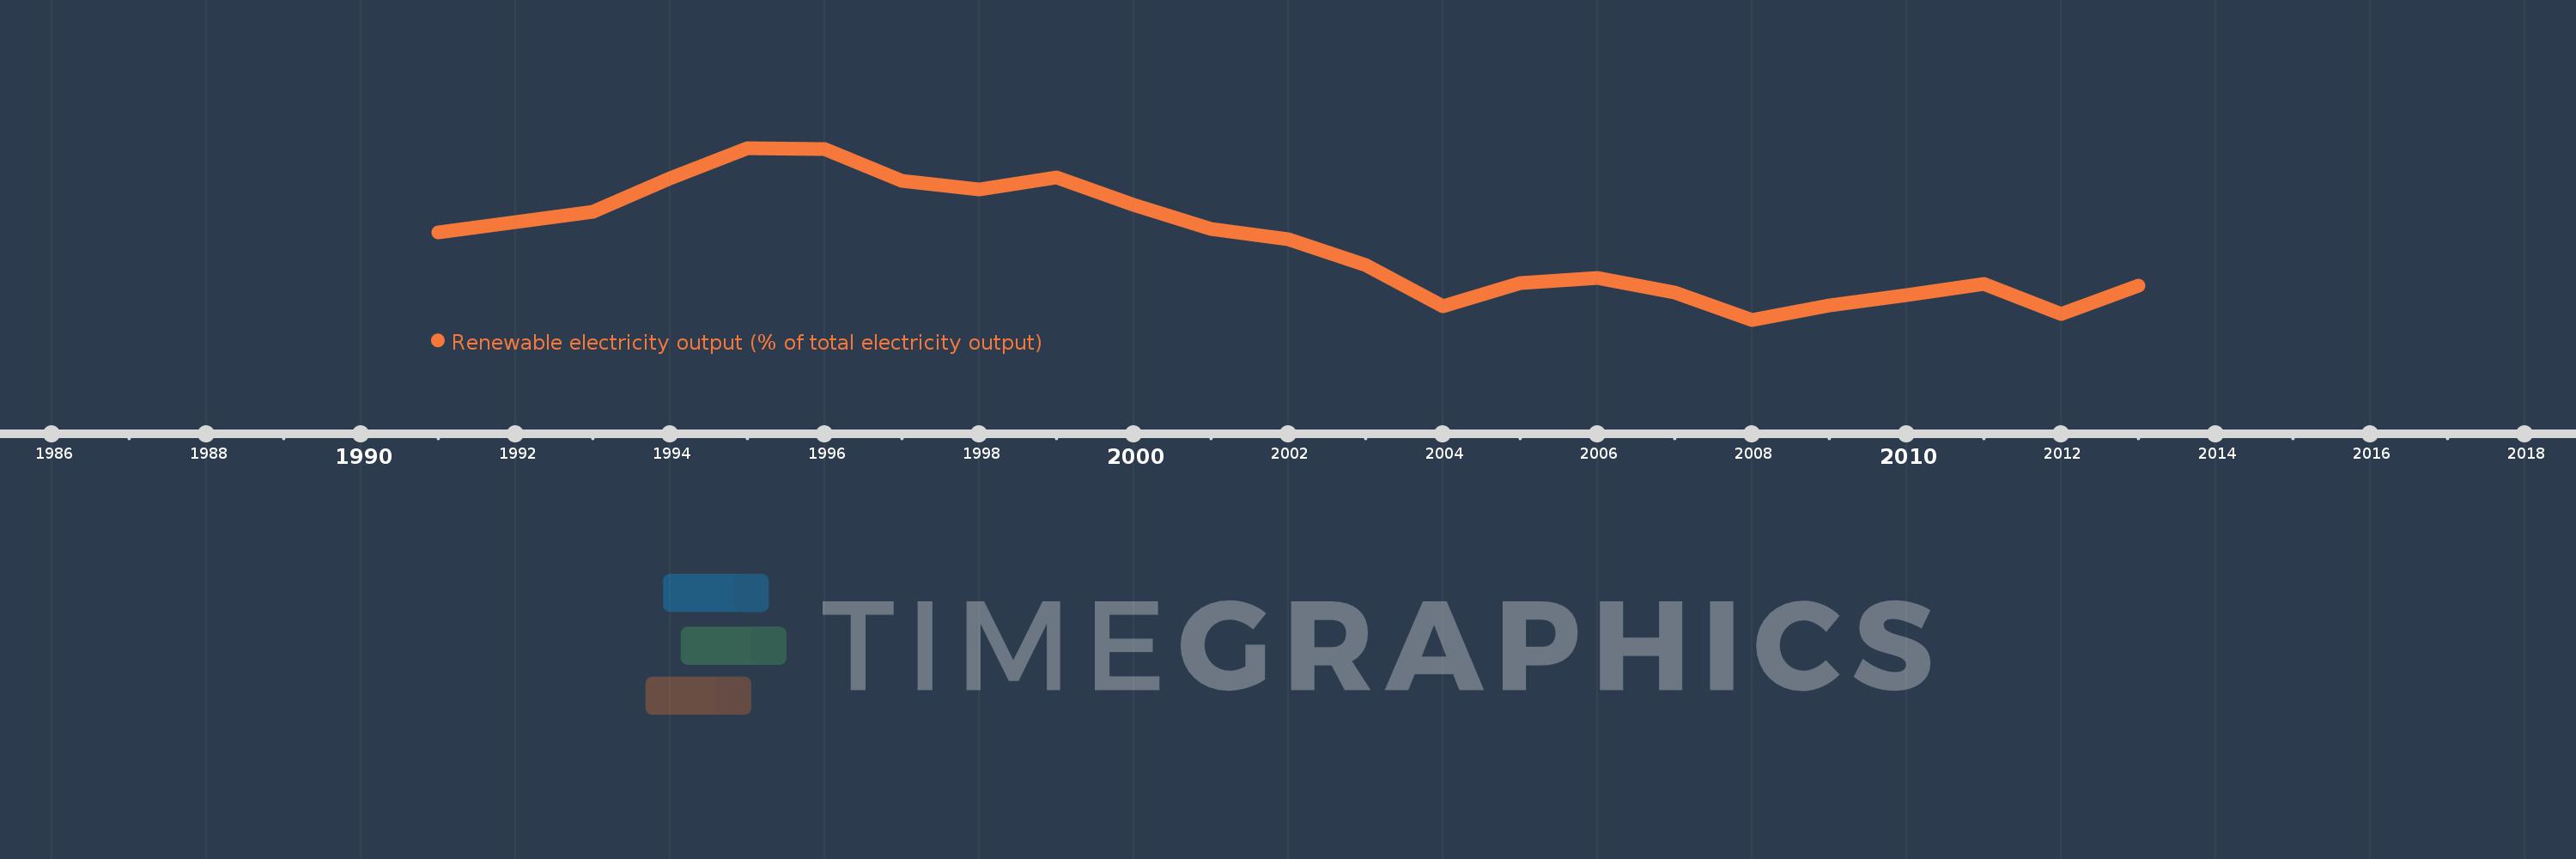
Renewable electricity output (% of total electricity output)
2013,2012,2011,2010,2009,2008,2007,2006,2005,2004,2003,2002,2001,2000,1999,1998,1997,1996,1995,1994,1993,1992,1991
Queste statistiche in altri paesi:
AfghanistanAlbaniaAlgeriaAngolaAntigua and BarbudaArab WorldArgentinaArmeniaArubaAustraliaAustriaAzerbaijanBahamas, TheBahrainBangladeshBarbadosBelarusBelgiumBelizeBeninBermudaBhutanBoliviaBosnia and HerzegovinaBotswanaBrazilBritish Virgin IslandsBrunei DarussalamBulgariaBurkina FasoBurundiCabo VerdeCambodiaCameroonCanadaCaribbean small statesCayman IslandsCentral African RepublicCentral Europe and the BalticsChadChileChinaColombiaComorosCongo, Dem. Rep.Congo, Rep.Costa RicaCote d'IvoireCroatiaCubaCyprusCzech RepublicDenmarkDjiboutiDominicaDominican RepublicEarly-demographic dividendEast Asia & PacificEast Asia & Pacific (excluding high income)East Asia & Pacific (IDA & IBRD countries)EcuadorEgypt, Arab Rep.El SalvadorEquatorial GuineaEritreaEstoniaEthiopiaEuro areaEurope & Central AsiaEurope & Central Asia (excluding high income)Europe & Central Asia (IDA & IBRD countries)European UnionFijiFinlandFragile and conflict affected situationsFranceFrench PolynesiaGabonGambia, TheGeorgiaGermanyGhanaGibraltarGreeceGrenadaGuatemalaGuineaGuinea-BissauGuyanaHaitiHeavily indebted poor countries (HIPC)High incomeHondurasHungaryIBRD onlyIcelandIDA & IBRD totalIDA blendIDA onlyIDA totalIndiaIndonesiaIran, Islamic Rep.IraqIrelandIsraelItalyJamaicaJapanJordanKazakhstanKenyaKiribatiKorea, Dem. People’s Rep.Korea, Rep.KosovoKuwaitKyrgyz RepublicLao PDRLate-demographic dividendLatin America & Caribbean Latin America & Caribbean (excluding high income)Latin America & the Caribbean (IDA & IBRD countries)LatviaLeast developed countries: UN classificationLebanonLesothoLiberiaLibyaLithuaniaLow & middle incomeLow incomeLower middle incomeLuxembourgMacao SAR, ChinaMacedonia, FYRMadagascarMalawiMalaysiaMaldivesMaliMaltaMauritaniaMauritiusMexicoMiddle East & North AfricaMiddle East & North Africa (excluding high income)Middle East & North Africa (IDA & IBRD countries)Middle incomeMoldovaMongoliaMontenegroMoroccoMozambiqueMyanmarNamibiaNepalNetherlandsNew CaledoniaNew ZealandNicaraguaNigerNigeriaNorth AmericaNorwayOECD membersOmanOther small statesPacific island small statesPakistanPalauPanamaPapua New GuineaParaguayPeruPhilippinesPolandPortugalPost-demographic dividendPre-demographic dividendPuerto RicoQatarRomaniaRussian FederationRwandaSamoaSao Tome and PrincipeSaudi ArabiaSenegalSerbiaSeychellesSierra LeoneSingaporeSlovak RepublicSloveniaSmall statesSolomon IslandsSomaliaSouth AfricaSouth AsiaSouth Asia (IDA & IBRD)SpainSri LankaSt. Kitts and NevisSt. LuciaSt. Vincent and the GrenadinesSub-Saharan Africa Sub-Saharan Africa (excluding high income)Sub-Saharan Africa (IDA & IBRD countries)SudanSurinameSwazilandSwedenSwitzerlandSyrian Arab RepublicTajikistanTanzaniaThailandTimor-LesteTogoTongaTrinidad and TobagoTunisiaTurkeyTurkmenistanTurks and Caicos IslandsUgandaUkraineUnited Arab EmiratesUnited KingdomUnited StatesUpper middle incomeUruguayUzbekistanVanuatuVenezuela, RBVietnamWorldYemen, Rep.ZambiaZimbabwe Linea del tempo:
Questa scala temporale mostra un grafico dal 1991 anno al 2013 anno. IDA & IBRD total. I dati fino ad 1990 anno non disponibili. Il numero di osservazioni attuali secondo i date: 23.
La fonte (nome):
Indicatori dello sviluppo mondiale
La fonte (organizzazione):
© OECD/IEA and World Bank, based on IEA data in IEA World Energy Balances © OECD/IEA 2013 edition, subject to https://www.iea.org/t&c/termsandconditions/
Categorie:
Energy & Mining, Climate Change, Environment
sono stati aggiornati
23 apr 2017 anni
Indicatori delle variazioni dei valori per anni
Minima:
21.492
1 gen 2008 anni
Massimo:
26.001
1 gen 1995 anni
Alla data di osservazione
Valore
Variazione assoluta
La variazione rispetto al valore precedente
1 gen 1991 anni
23.777
+23.777
0.0%
1 gen 1992 anni
24.065
+0.287
1.21%
1 gen 1993 anni
24.325
+0.26
1.08%
1 gen 1994 anni
25.208
+0.883
3.63%
1 gen 1995 anni
26.001
+0.793
3.14%
1 gen 1996 anni
25.968
-0.033
-0.13%
1 gen 1997 anni
25.132
-0.836
-3.22%
1 gen 1998 anni
24.917
-0.215
-0.85%
1 gen 1999 anni
25.234
+0.317
1.27%
1 gen 2000 anni
24.51
-0.724
-2.87%
1 gen 2001 anni
23.874
-0.636
-2.59%
1 gen 2002 anni
23.604
-0.27
-1.13%
1 gen 2003 anni
22.918
-0.686
-2.9%
1 gen 2004 anni
21.851
-1.068
-4.66%
1 gen 2005 anni
22.452
+0.601
2.75%
1 gen 2006 anni
22.593
+0.141
0.63%
1 gen 2007 anni
22.202
-0.391
-1.73%
1 gen 2008 anni
21.492
-0.71
-3.2%
1 gen 2009 anni
21.868
+0.376
1.75%
1 gen 2010 anni
22.13
+0.262
1.2%
1 gen 2011 anni
22.442
+0.313
1.41%
1 gen 2012 anni
21.635
-0.807
-3.6%
1 gen 2013 anni
22.387
+0.751
3.47%
Classificazione dei paesi secondo i statistiche attuali per anni


Commenti: