29
/it/
it
AIzaSyAYiBZKx7MnpbEhh9jyipgxe19OcubqV5w
April 1, 2024
37315
IDA & IBRD total
IBT
false
2
1
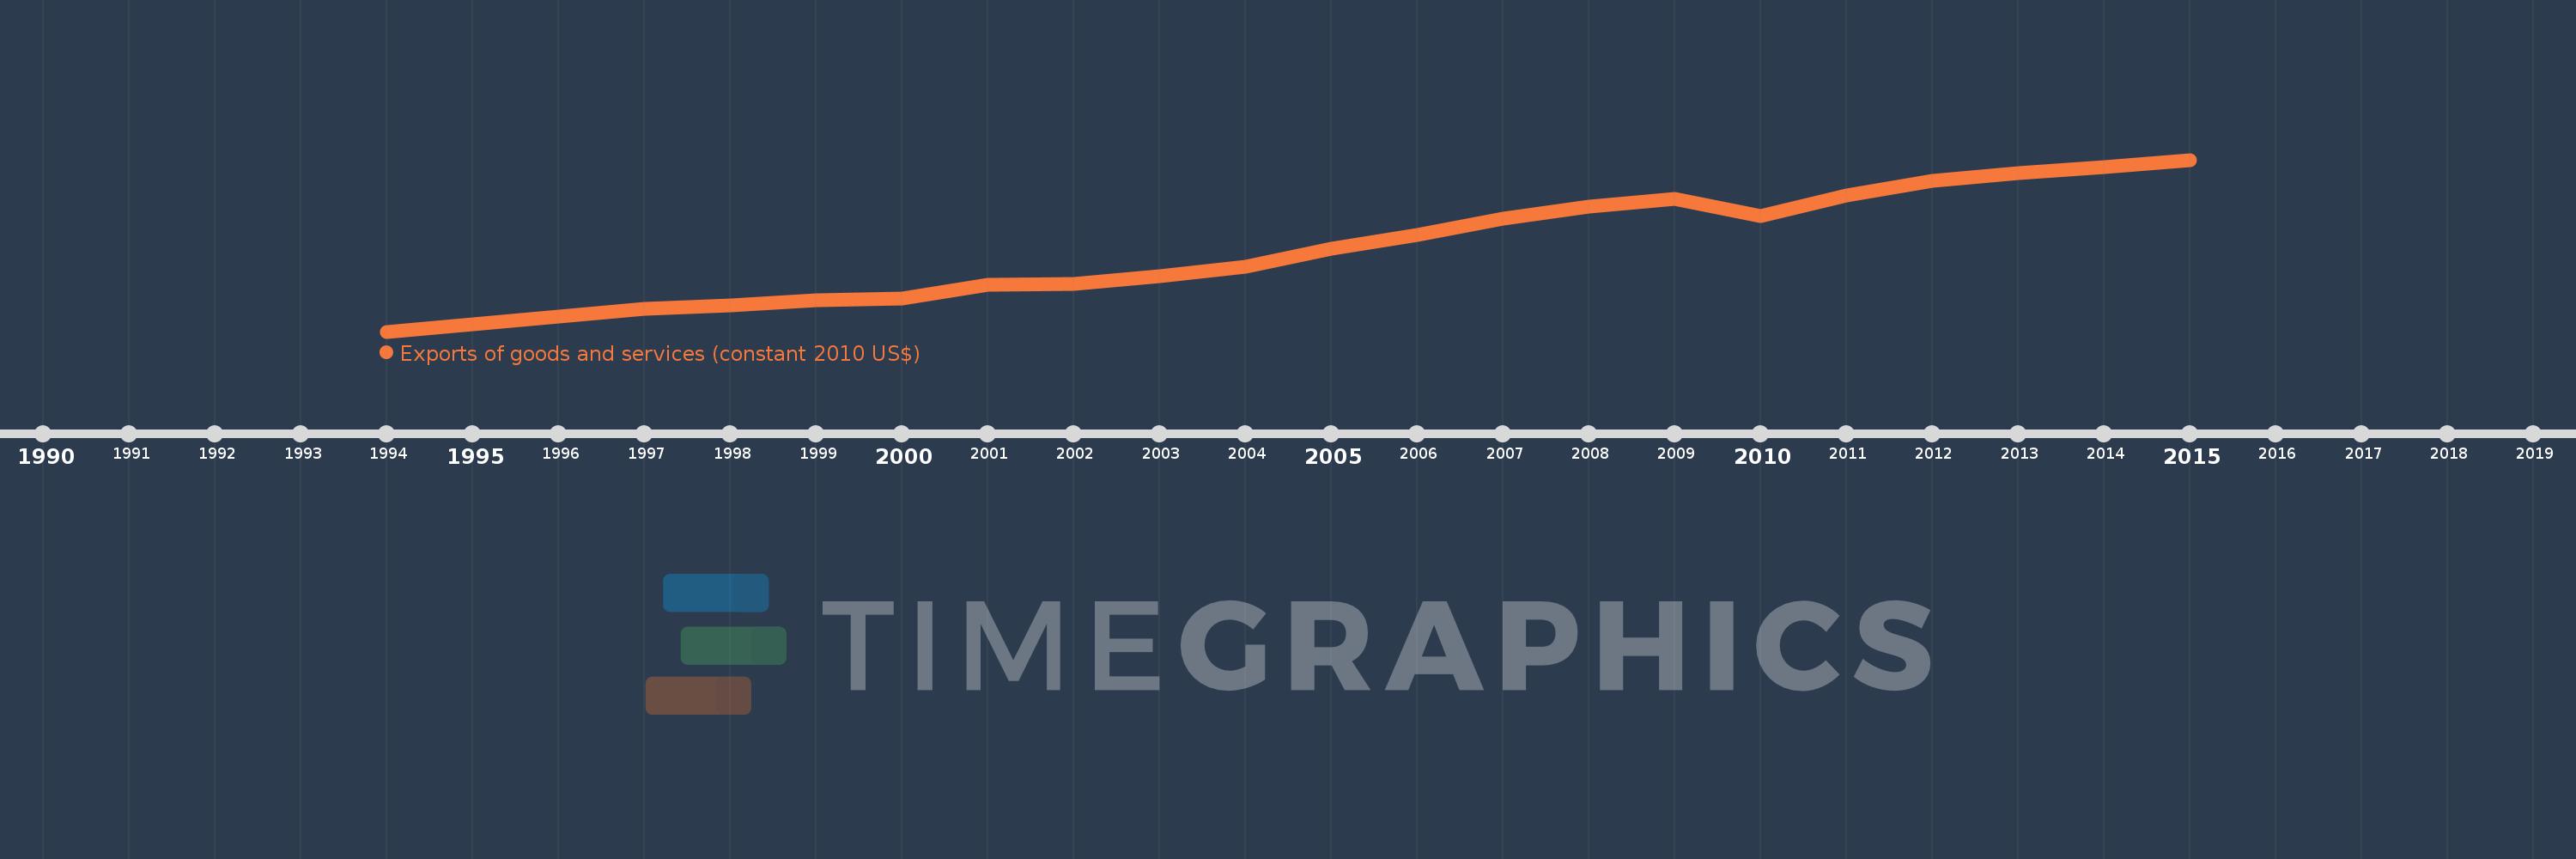
Exports of goods and services (constant 2010 US$)
2015,2014,2013,2012,2011,2010,2009,2008,2007,2006,2005,2004,2003,2002,2001,2000,1999,1998,1997,1996,1995,1994
Queste statistiche in altri paesi:
AfghanistanAlbaniaAlgeriaAngolaAntigua and BarbudaArab WorldArgentinaArmeniaArubaAustraliaAustriaAzerbaijanBahamas, TheBahrainBangladeshBarbadosBelarusBelgiumBelizeBeninBermudaBhutanBoliviaBosnia and HerzegovinaBotswanaBrazilBrunei DarussalamBulgariaBurkina FasoBurundiCabo VerdeCambodiaCameroonCanadaCaribbean small statesCentral African RepublicCentral Europe and the BalticsChadChileChinaColombiaComorosCongo, Dem. Rep.Congo, Rep.Costa RicaCote d'IvoireCroatiaCubaCyprusCzech RepublicDenmarkDominicaDominican RepublicEarly-demographic dividendEast Asia & PacificEast Asia & Pacific (excluding high income)East Asia & Pacific (IDA & IBRD countries)EcuadorEgypt, Arab Rep.El SalvadorEquatorial GuineaEritreaEstoniaEuro areaEurope & Central AsiaEurope & Central Asia (excluding high income)Europe & Central Asia (IDA & IBRD countries)European UnionFaroe IslandsFijiFinlandFragile and conflict affected situationsFranceGabonGambia, TheGeorgiaGermanyGhanaGreeceGrenadaGuatemalaGuineaGuinea-BissauGuyanaHaitiHeavily indebted poor countries (HIPC)High incomeHondurasHong Kong SAR, ChinaHungaryIBRD onlyIcelandIDA & IBRD totalIDA blendIDA onlyIDA totalIndiaIndonesiaIran, Islamic Rep.IraqIrelandIsraelItalyJamaicaJapanJordanKazakhstanKenyaKiribatiKorea, Rep.KosovoKuwaitKyrgyz RepublicLao PDRLate-demographic dividendLatin America & Caribbean Latin America & Caribbean (excluding high income)Latin America & the Caribbean (IDA & IBRD countries)LatviaLeast developed countries: UN classificationLebanonLiberiaLibyaLithuaniaLow & middle incomeLow incomeLower middle incomeLuxembourgMacao SAR, ChinaMacedonia, FYRMadagascarMalawiMalaysiaMaldivesMaliMaltaMauritaniaMauritiusMexicoMiddle East & North AfricaMiddle East & North Africa (excluding high income)Middle East & North Africa (IDA & IBRD countries)Middle incomeMoldovaMongoliaMontenegroMoroccoMozambiqueMyanmarNamibiaNepalNetherlandsNew ZealandNicaraguaNigerNigeriaNorth AmericaNorwayOECD membersOmanOther small statesPacific island small statesPakistanPalauPanamaParaguayPeruPhilippinesPolandPortugalPost-demographic dividendPre-demographic dividendPuerto RicoQatarRomaniaRussian FederationRwandaSamoaSaudi ArabiaSenegalSerbiaSeychellesSierra LeoneSingaporeSlovak RepublicSloveniaSmall statesSolomon IslandsSouth AfricaSouth AsiaSouth Asia (IDA & IBRD)South SudanSpainSri LankaSt. Kitts and NevisSt. LuciaSt. Vincent and the GrenadinesSub-Saharan Africa Sub-Saharan Africa (excluding high income)Sub-Saharan Africa (IDA & IBRD countries)SudanSurinameSwazilandSwedenSwitzerlandTajikistanTanzaniaThailandTimor-LesteTogoTongaTrinidad and TobagoTunisiaTurkeyTurkmenistanUgandaUkraineUnited Arab EmiratesUnited KingdomUnited StatesUpper middle incomeUruguayUzbekistanVanuatuVenezuela, RBVietnamWest Bank and GazaWorldYemen, Rep.ZambiaZimbabwe Linea del tempo:
Questa scala temporale mostra un grafico dal 1994 anno al 2015 anno. IDA & IBRD total. I dati fino ad 1993 anno non disponibili. Il numero di osservazioni attuali secondo i date: 22.
La fonte (nome):
Indicatori dello sviluppo mondiale
La fonte (organizzazione):
World Bank national accounts data, and OECD National Accounts data files.
Categorie:
Economy & Growth, Trade
sono stati aggiornati
23 apr 2017 anni
Indicatori delle variazioni dei valori per anni
Minima:
2.239 Trln
1 gen 1994 anni
Massimo:
6.854 Trln
1 gen 2015 anni
Alla data di osservazione
Valore
Variazione assoluta
La variazione rispetto al valore precedente
1 gen 1994 anni
2.239 Trln
+2.239 Trln
0.0%
1 gen 1995 anni
2.432 Trln
+192.56 Mlrd
8.6%
1 gen 1996 anni
2.647 Trln
+215.122 Mlrd
8.85%
1 gen 1997 anni
2.841 Trln
+194.786 Mlrd
7.36%
1 gen 1998 anni
2.951 Trln
+109.342 Mlrd
3.85%
1 gen 1999 anni
3.075 Trln
+124.243 Mlrd
4.21%
1 gen 2000 anni
3.123 Trln
+47.985 Mlrd
1.56%
1 gen 2001 anni
3.495 Trln
+371.893 Mlrd
11.91%
1 gen 2002 anni
3.529 Trln
+34.31 Mlrd
0.98%
1 gen 2003 anni
3.724 Trln
+194.944 Mlrd
5.52%
1 gen 2004 anni
3.989 Trln
+264.57 Mlrd
7.1%
1 gen 2005 anni
4.461 Trln
+472.246 Mlrd
11.84%
1 gen 2006 anni
4.838 Trln
+377.092 Mlrd
8.45%
1 gen 2007 anni
5.275 Trln
+437.335 Mlrd
9.04%
1 gen 2008 anni
5.586 Trln
+310.835 Mlrd
5.89%
1 gen 2009 anni
5.81 Trln
+223.7 Mlrd
4.0%
1 gen 2010 anni
5.333 Trln
-476.696 Mlrd
-8.2%
1 gen 2011 anni
5.907 Trln
+573.683 Mlrd
10.76%
1 gen 2012 anni
6.283 Trln
+375.857 Mlrd
6.36%
1 gen 2013 anni
6.49 Trln
+207.03 Mlrd
3.3%
1 gen 2014 anni
6.665 Trln
+174.788 Mlrd
2.69%
1 gen 2015 anni
6.854 Trln
+189.432 Mlrd
2.84%
Classificazione dei paesi secondo i statistiche attuali per anni


Commenti: