30
/it/
AIzaSyAYiBZKx7MnpbEhh9jyipgxe19OcubqV5w
April 1, 2024
37251
IDA & IBRD total
IBT
false
2
1
CPIA structural policies cluster average (1=low to 6=high)
2016,2015,2014,2013,2012,2011,2010,2009,2008,2007,2006
Download
Biblioteca di statistiche globali →IDA & IBRD total →

CPIA structural policies cluster average (1=low to 6=high)

Queste statistiche in altri paesi:

AfghanistanAlbaniaAngolaArab WorldArmeniaAzerbaijanBangladeshBeninBhutanBoliviaBosnia and HerzegovinaBurkina FasoBurundiCabo VerdeCambodiaCameroonCaribbean small statesCentral African RepublicChadComorosCongo, Dem. Rep.Congo, Rep.Cote d'IvoireDjiboutiDominicaEarly-demographic dividendEast Asia & PacificEast Asia & Pacific (excluding high income)East Asia & Pacific (IDA & IBRD countries)EritreaEthiopiaEurope & Central AsiaEurope & Central Asia (excluding high income)Europe & Central Asia (IDA & IBRD countries)Fragile and conflict affected situationsGambia, TheGeorgiaGhanaGrenadaGuineaGuinea-BissauGuyanaHaitiHeavily indebted poor countries (HIPC)HondurasIBRD onlyIDA & IBRD totalIDA blendIDA onlyIDA totalIndiaIndonesiaKenyaKiribatiKosovoKyrgyz RepublicLao PDRLate-demographic dividendLatin America & Caribbean Latin America & Caribbean (excluding high income)Latin America & the Caribbean (IDA & IBRD countries)Least developed countries: UN classificationLesothoLiberiaLow & middle incomeLow incomeLower middle incomeMadagascarMalawiMaldivesMaliMarshall IslandsMauritaniaMicronesia, Fed. Sts.Middle East & North AfricaMiddle East & North Africa (excluding high income)Middle East & North Africa (IDA & IBRD countries)Middle incomeMoldovaMongoliaMozambiqueMyanmarNepalNicaraguaNigerNigeriaOther small statesPacific island small statesPakistanPapua New GuineaPost-demographic dividendPre-demographic dividendRwandaSamoaSao Tome and PrincipeSenegalSerbiaSierra LeoneSmall statesSolomon IslandsSouth AsiaSouth Asia (IDA & IBRD)South SudanSri LankaSt. LuciaSt. Vincent and the GrenadinesSub-Saharan Africa Sub-Saharan Africa (excluding high income)Sub-Saharan Africa (IDA & IBRD countries)SudanTajikistanTanzaniaTimor-LesteTogoTongaTuvaluUgandaUpper middle incomeUzbekistanVanuatuVietnamWorldYemen, Rep.ZambiaZimbabwe

Linea del tempo:

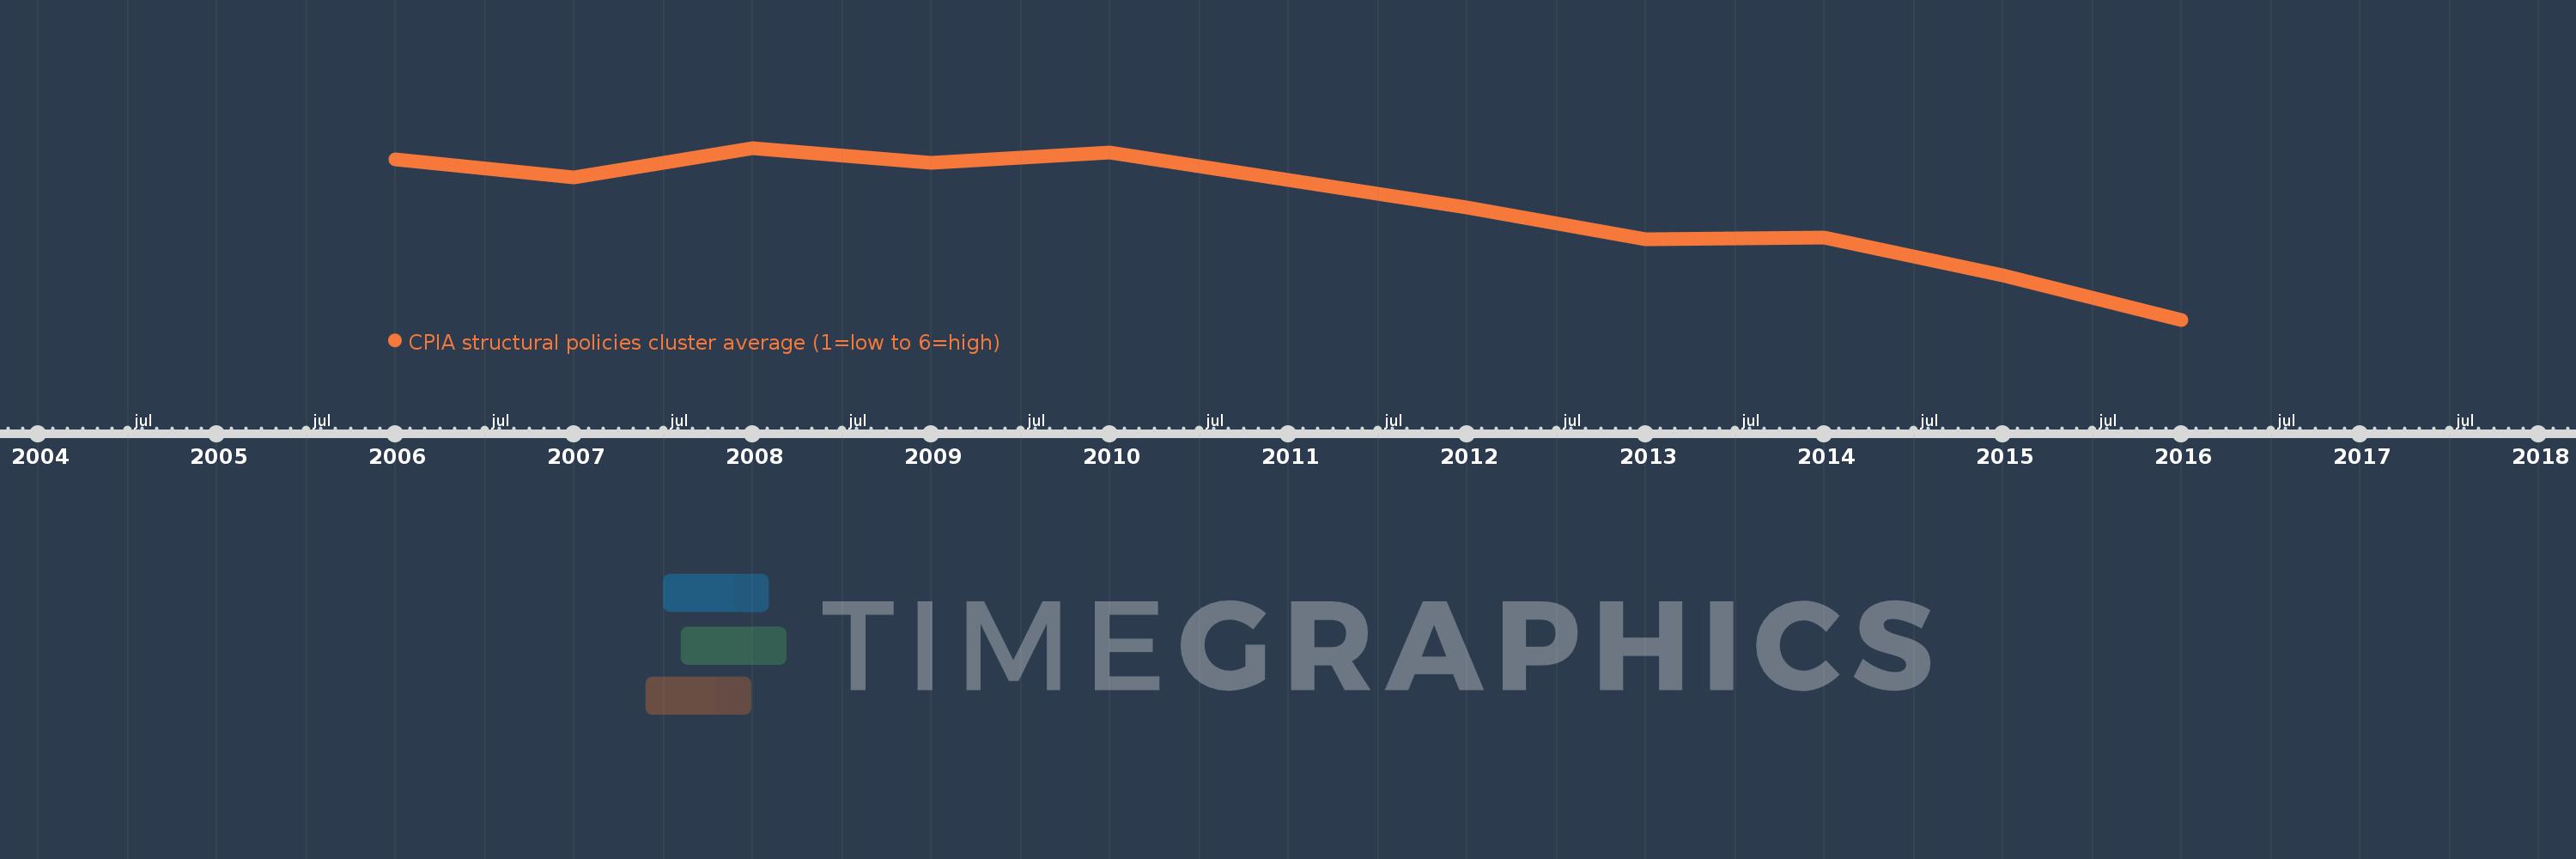
Questa scala temporale mostra un grafico dal 2006 anno al 2016 anno. IDA & IBRD total. I dati fino ad 2005 anno non disponibili. Il numero di osservazioni attuali secondo i date: 11.

La fonte (nome):

Indicatori dello sviluppo mondiale

La fonte (organizzazione):

World Bank Group, CPIA database (http://www.worldbank.org/ida).

Categorie:

Public Sector

sono stati aggiornati

23 apr 2017 anni

Indicatori delle variazioni dei valori per anni

In media:
3.359
Minima:
3.259
1 gen 2016 anni
Massimo:
3.409
1 gen 2008 anni
Alla data di osservazione
Valore
Variazione assoluta
La variazione rispetto al valore precedente
1 gen 2006 anni
3.399
+3.399
0.0%
1 gen 2007 anni
3.383
-0.016
-0.48%
1 gen 2008 anni
3.409
+0.026
0.77%
1 gen 2009 anni
3.396
-0.013
-0.38%
1 gen 2010 anni
3.405
+0.009
0.26%
1 gen 2011 anni
3.381
-0.024
-0.7%
1 gen 2012 anni
3.357
-0.024
-0.71%
1 gen 2013 anni
3.329
-0.028
-0.82%
1 gen 2014 anni
3.331
+0.002
0.06%
1 gen 2015 anni
3.298
-0.033
-0.99%
1 gen 2016 anni
3.259
-0.039
-1.2%

Classificazione dei paesi secondo i statistiche attuali per anni