29
/it/
it
AIzaSyAYiBZKx7MnpbEhh9jyipgxe19OcubqV5w
April 1, 2024
36762
IBRD only
IBD
false
2
1
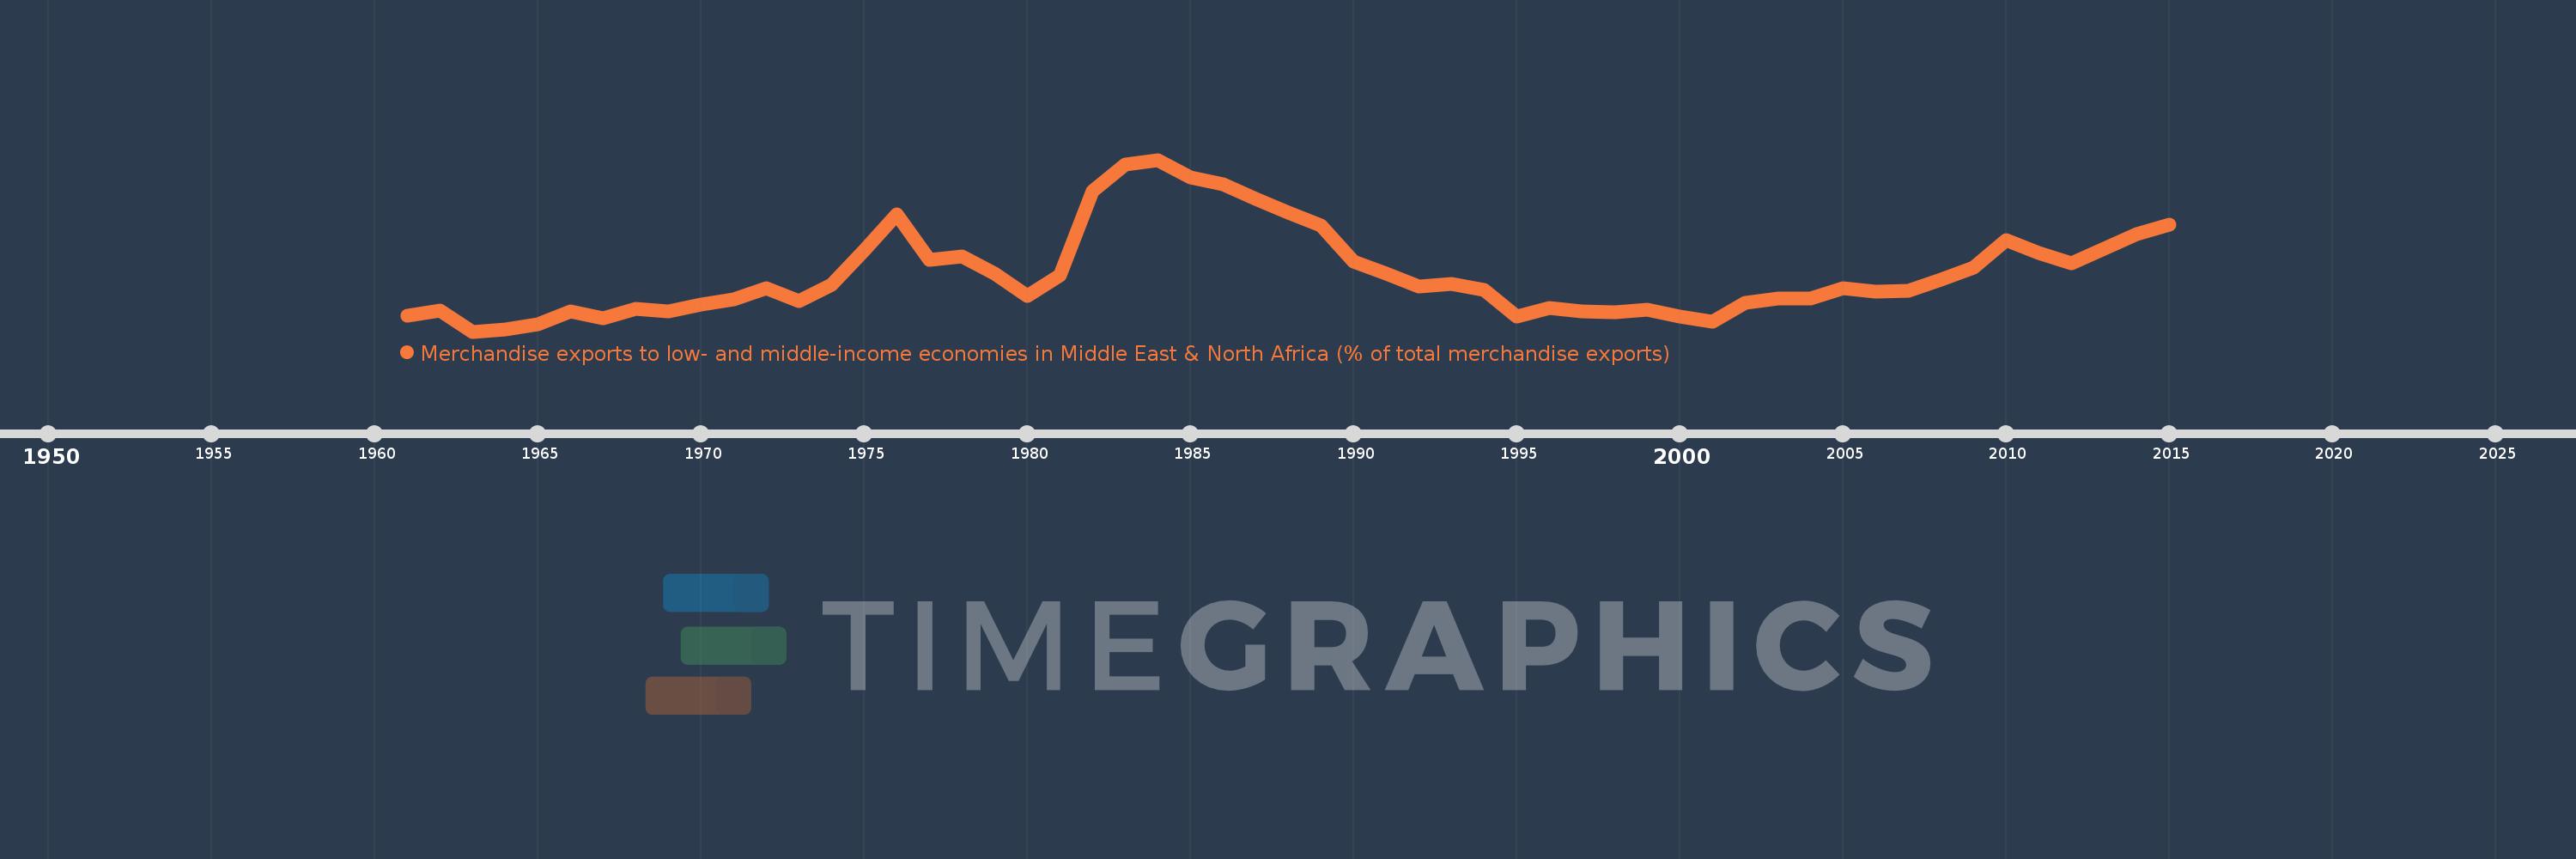
Merchandise exports to low- and middle-income economies in Middle East & North Africa (% of total merchandise exports)
2015,2014,2013,2012,2011,2010,2009,2008,2007,2006,2005,2004,2003,2002,2001,2000,1999,1998,1997,1996,1995,1994,1993,1992,1991,1990,1989,1988,1987,1986,1985,1984,1983,1982,1981,1980,1979,1978,1977,1976,1975,1974,1973,1972,1971,1970,1969,1968,1967,1966,1965,1964,1963,1962,1961
Queste statistiche in altri paesi:
AfghanistanAlbaniaAlgeriaAngolaArab WorldArgentinaArmeniaArubaAustraliaAustriaAzerbaijanBahamas, TheBahrainBangladeshBarbadosBelarusBelgiumBelizeBeninBermudaBoliviaBosnia and HerzegovinaBrazilBrunei DarussalamBulgariaBurkina FasoBurundiCabo VerdeCambodiaCameroonCanadaCaribbean small statesCentral African RepublicCentral Europe and the BalticsChadChileChinaColombiaComorosCongo, Dem. Rep.Congo, Rep.Costa RicaCote d'IvoireCroatiaCubaCyprusCzech RepublicDenmarkDjiboutiDominicaDominican RepublicEarly-demographic dividendEast Asia & PacificEast Asia & Pacific (excluding high income)East Asia & Pacific (IDA & IBRD countries)EcuadorEgypt, Arab Rep.El SalvadorEquatorial GuineaEstoniaEthiopiaEuro areaEurope & Central AsiaEurope & Central Asia (excluding high income)Europe & Central Asia (IDA & IBRD countries)European UnionFijiFinlandFragile and conflict affected situationsFranceGabonGambia, TheGeorgiaGermanyGhanaGreeceGreenlandGrenadaGuatemalaGuineaGuinea-BissauGuyanaHaitiHeavily indebted poor countries (HIPC)High incomeHondurasHong Kong SAR, ChinaHungaryIBRD onlyIcelandIDA & IBRD totalIDA blendIDA onlyIDA totalIndiaIndonesiaIran, Islamic Rep.IraqIrelandIsraelItalyJamaicaJapanJordanKazakhstanKenyaKorea, Dem. People’s Rep.Korea, Rep.KosovoKuwaitKyrgyz RepublicLao PDRLate-demographic dividendLatin America & Caribbean Latin America & Caribbean (excluding high income)Latin America & the Caribbean (IDA & IBRD countries)LatviaLeast developed countries: UN classificationLebanonLiberiaLibyaLithuaniaLow & middle incomeLow incomeLower middle incomeLuxembourgMacao SAR, ChinaMacedonia, FYRMadagascarMalawiMalaysiaMaliMaltaMauritaniaMauritiusMexicoMiddle East & North AfricaMiddle East & North Africa (excluding high income)Middle East & North Africa (IDA & IBRD countries)Middle incomeMoldovaMongoliaMontenegroMoroccoMozambiqueMyanmarNepalNetherlandsNew CaledoniaNew ZealandNicaraguaNigerNigeriaNorth AmericaNorwayOECD membersOmanOther small statesPacific island small statesPakistanPanamaPapua New GuineaParaguayPeruPhilippinesPolandPortugalPost-demographic dividendPre-demographic dividendQatarRomaniaRussian FederationRwandaSamoaSaudi ArabiaSenegalSerbiaSeychellesSierra LeoneSingaporeSlovak RepublicSloveniaSmall statesSomaliaSouth AfricaSouth AsiaSouth Asia (IDA & IBRD)SpainSri LankaSt. LuciaSub-Saharan Africa Sub-Saharan Africa (excluding high income)Sub-Saharan Africa (IDA & IBRD countries)SudanSurinameSwedenSwitzerlandSyrian Arab RepublicTajikistanTanzaniaThailandTogoTrinidad and TobagoTunisiaTurkeyTurkmenistanUgandaUkraineUnited Arab EmiratesUnited KingdomUnited StatesUpper middle incomeUruguayUzbekistanVenezuela, RBVietnamWorldYemen, Rep.ZambiaZimbabwe Linea del tempo:
Questa scala temporale mostra un grafico dal 1961 anno al 2015 anno. IBRD only. I dati fino ad 1960 anno non disponibili. Il numero di osservazioni attuali secondo i date: 55.
La fonte (nome):
Indicatori dello sviluppo mondiale
La fonte (organizzazione):
World Bank staff estimates based data from International Monetary Fund's Direction of Trade database.
Categorie:
Private Sector, Trade
sono stati aggiornati
23 apr 2017 anni
Indicatori delle variazioni dei valori per anni
Minima:
1.308
1 gen 1963 anni
Massimo:
4.407
1 gen 1984 anni
Alla data di osservazione
Valore
Variazione assoluta
La variazione rispetto al valore precedente
1 gen 1961 anni
1.592
+1.592
0.0%
1 gen 1962 anni
1.682
+0.091
5.71%
1 gen 1963 anni
1.308
-0.375
-22.26%
1 gen 1964 anni
1.342
+0.034
2.6%
1 gen 1965 anni
1.432
+0.09
6.72%
1 gen 1966 anni
1.672
+0.24
16.73%
1 gen 1967 anni
1.554
-0.117
-7.01%
1 gen 1968 anni
1.718
+0.163
10.5%
1 gen 1969 anni
1.666
-0.052
-3.03%
1 gen 1970 anni
1.79
+0.124
7.47%
1 gen 1971 anni
1.887
+0.097
5.4%
1 gen 1972 anni
2.09
+0.203
10.76%
1 gen 1973 anni
1.861
-0.229
-10.95%
1 gen 1974 anni
2.149
+0.288
15.5%
1 gen 1975 anni
2.777
+0.628
29.22%
1 gen 1976 anni
3.416
+0.638
22.99%
1 gen 1977 anni
2.6
-0.816
-23.88%
1 gen 1978 anni
2.658
+0.058
2.22%
1 gen 1979 anni
2.353
-0.305
-11.48%
1 gen 1980 anni
1.956
-0.396
-16.85%
1 gen 1981 anni
2.317
+0.361
18.45%
1 gen 1982 anni
3.837
+1.52
65.6%
1 gen 1983 anni
4.315
+0.478
12.46%
1 gen 1984 anni
4.407
+0.092
2.12%
1 gen 1985 anni
4.084
-0.323
-7.33%
1 gen 1986 anni
3.968
-0.117
-2.86%
1 gen 1987 anni
3.708
-0.259
-6.53%
1 gen 1988 anni
3.452
-0.257
-6.93%
1 gen 1989 anni
3.217
-0.235
-6.8%
1 gen 1990 anni
2.571
-0.646
-20.08%
1 gen 1991 anni
2.358
-0.212
-8.26%
1 gen 1992 anni
2.123
-0.236
-9.99%
1 gen 1993 anni
2.172
+0.049
2.31%
1 gen 1994 anni
2.054
-0.118
-5.45%
1 gen 1995 anni
1.58
-0.474
-23.08%
1 gen 1996 anni
1.734
+0.155
9.8%
1 gen 1997 anni
1.672
-0.063
-3.63%
1 gen 1998 anni
1.652
-0.019
-1.16%
1 gen 1999 anni
1.707
+0.055
3.34%
1 gen 2000 anni
1.576
-0.131
-7.68%
1 gen 2001 anni
1.485
-0.091
-5.76%
1 gen 2002 anni
1.834
+0.348
23.45%
1 gen 2003 anni
1.904
+0.07
3.83%
1 gen 2004 anni
1.897
-0.007
-0.37%
1 gen 2005 anni
2.085
+0.188
9.93%
1 gen 2006 anni
2.025
-0.06
-2.87%
1 gen 2007 anni
2.04
+0.015
0.74%
1 gen 2008 anni
2.253
+0.213
10.43%
1 gen 2009 anni
2.47
+0.216
9.6%
1 gen 2010 anni
2.963
+0.493
19.97%
1 gen 2011 anni
2.729
-0.234
-7.91%
1 gen 2012 anni
2.547
-0.181
-6.64%
1 gen 2013 anni
2.796
+0.248
9.75%
1 gen 2014 anni
3.061
+0.265
9.46%
1 gen 2015 anni
3.243
+0.182
5.95%
Classificazione dei paesi secondo i statistiche attuali per anni


Commenti: