29
/it/
it
AIzaSyAYiBZKx7MnpbEhh9jyipgxe19OcubqV5w
April 1, 2024
36401
IBRD only
IBD
false
2
1
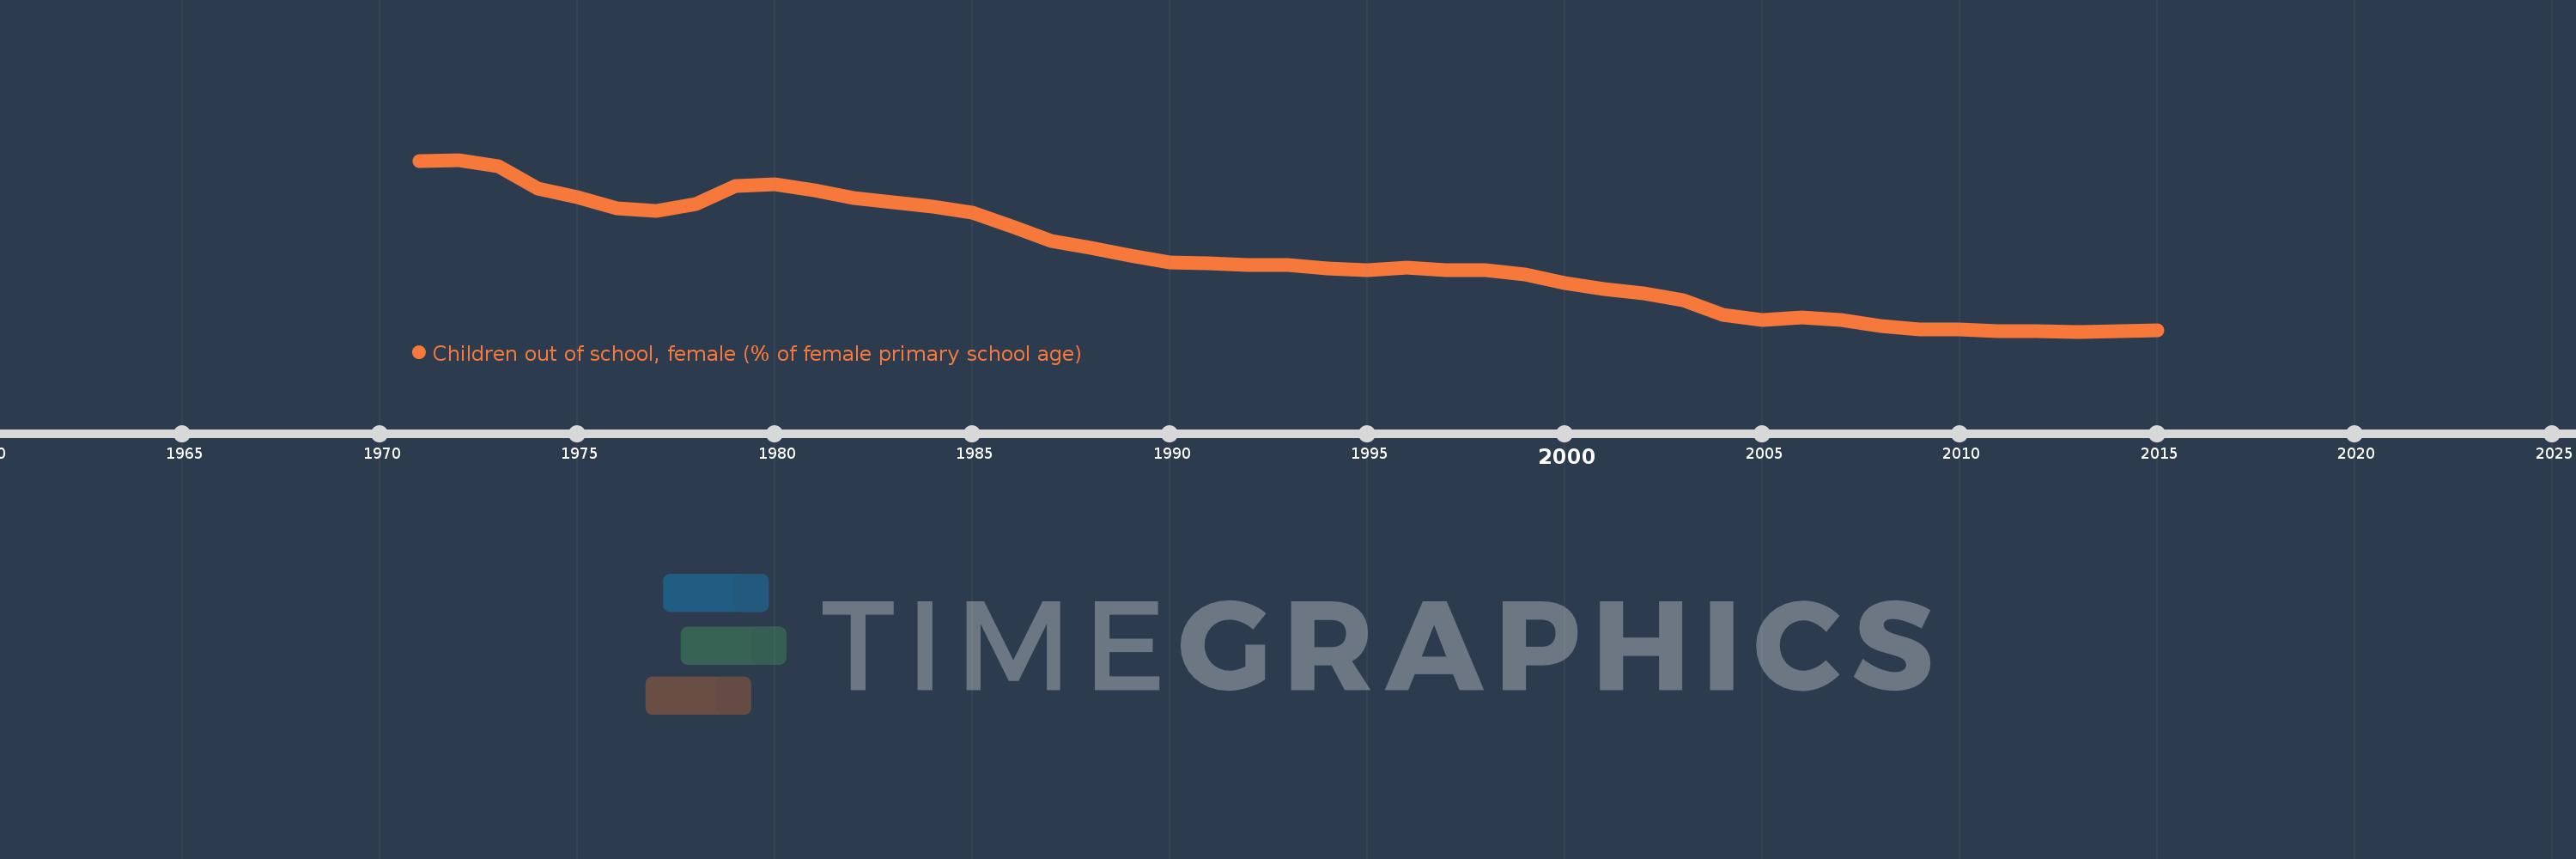
Children out of school, female (% of female primary school age)
2015,2014,2013,2012,2011,2010,2009,2008,2007,2006,2005,2004,2003,2002,2001,2000,1999,1998,1997,1996,1995,1994,1993,1992,1991,1990,1989,1988,1987,1986,1985,1984,1983,1982,1981,1980,1979,1978,1977,1976,1975,1974,1973,1972,1971
Queste statistiche in altri paesi:
AfghanistanAlbaniaAlgeriaAngolaAntigua and BarbudaArab WorldArgentinaArmeniaArubaAustraliaAustriaAzerbaijanBahamas, TheBahrainBangladeshBarbadosBelarusBelgiumBelizeBeninBermudaBhutanBoliviaBosnia and HerzegovinaBotswanaBrazilBrunei DarussalamBulgariaBurkina FasoBurundiCabo VerdeCambodiaCameroonCanadaCaribbean small statesCentral African RepublicCentral Europe and the BalticsChadChileChinaColombiaComorosCongo, Dem. Rep.Congo, Rep.Costa RicaCote d'IvoireCroatiaCubaCyprusDenmarkDjiboutiDominicaDominican RepublicEarly-demographic dividendEast Asia & PacificEast Asia & Pacific (excluding high income)East Asia & Pacific (IDA & IBRD countries)EcuadorEgypt, Arab Rep.El SalvadorEquatorial GuineaEritreaEstoniaEthiopiaEuro areaEurope & Central AsiaEurope & Central Asia (excluding high income)Europe & Central Asia (IDA & IBRD countries)European UnionFijiFinlandFragile and conflict affected situationsFranceGabonGambia, TheGeorgiaGhanaGreeceGrenadaGuatemalaGuineaGuinea-BissauGuyanaHaitiHeavily indebted poor countries (HIPC)High incomeHondurasHong Kong SAR, ChinaHungaryIBRD onlyIcelandIDA & IBRD totalIDA blendIDA onlyIDA totalIndiaIndonesiaIran, Islamic Rep.IraqIrelandIsraelItalyJamaicaJapanJordanKazakhstanKenyaKiribatiKorea, Dem. People’s Rep.Korea, Rep.KuwaitKyrgyz RepublicLao PDRLate-demographic dividendLatin America & Caribbean Latin America & Caribbean (excluding high income)Latin America & the Caribbean (IDA & IBRD countries)LatviaLeast developed countries: UN classificationLebanonLesothoLiberiaLibyaLiechtensteinLithuaniaLow & middle incomeLow incomeLower middle incomeLuxembourgMacao SAR, ChinaMacedonia, FYRMadagascarMalawiMaldivesMaliMaltaMarshall IslandsMauritaniaMauritiusMexicoMicronesia, Fed. Sts.Middle East & North AfricaMiddle East & North Africa (excluding high income)Middle East & North Africa (IDA & IBRD countries)Middle incomeMoldovaMongoliaMontenegroMoroccoMozambiqueMyanmarNamibiaNauruNepalNetherlandsNew ZealandNicaraguaNigerNigeriaNorth AmericaNorwayOECD membersOmanOther small statesPacific island small statesPakistanPanamaPapua New GuineaParaguayPeruPhilippinesPolandPortugalPost-demographic dividendPre-demographic dividendPuerto RicoQatarRomaniaRussian FederationRwandaSamoaSan MarinoSao Tome and PrincipeSaudi ArabiaSenegalSerbiaSeychellesSierra LeoneSloveniaSmall statesSolomon IslandsSomaliaSouth AfricaSouth AsiaSouth Asia (IDA & IBRD)South SudanSpainSri LankaSt. Kitts and NevisSt. LuciaSt. Vincent and the GrenadinesSub-Saharan Africa Sub-Saharan Africa (excluding high income)Sub-Saharan Africa (IDA & IBRD countries)SudanSurinameSwazilandSwedenSwitzerlandSyrian Arab RepublicTajikistanTanzaniaThailandTimor-LesteTogoTongaTrinidad and TobagoTunisiaTurkeyTuvaluUgandaUkraineUnited Arab EmiratesUnited KingdomUnited StatesUpper middle incomeUruguayUzbekistanVanuatuVenezuela, RBWest Bank and GazaWorldYemen, Rep.ZambiaZimbabwe Linea del tempo:
Questa scala temporale mostra un grafico dal 1971 anno al 2015 anno. IBRD only. I dati fino ad 1970 anno non disponibili. Il numero di osservazioni attuali secondo i date: 45.
La fonte (nome):
Indicatori dello sviluppo mondiale
La fonte (organizzazione):
United Nations Educational, Scientific, and Cultural Organization (UNESCO) Institute for Statistics.
Categorie:
Education
sono stati aggiornati
23 apr 2017 anni
Indicatori delle variazioni dei valori per anni
Minima:
3.585
1 gen 2013 anni
Massimo:
34.93
1 gen 1972 anni
Alla data di osservazione
Valore
Variazione assoluta
La variazione rispetto al valore precedente
1 gen 1971 anni
34.631
+34.631
0.0%
1 gen 1972 anni
34.93
+0.299
0.86%
1 gen 1973 anni
33.791
-1.139
-3.26%
1 gen 1974 anni
29.654
-4.137
-12.24%
1 gen 1975 anni
28.1
-1.554
-5.24%
1 gen 1976 anni
26.112
-1.988
-7.07%
1 gen 1977 anni
25.583
-0.53
-2.03%
1 gen 1978 anni
26.936
+1.353
5.29%
1 gen 1979 anni
30.191
+3.256
12.09%
1 gen 1980 anni
30.422
+0.23
0.76%
1 gen 1981 anni
29.39
-1.032
-3.39%
1 gen 1982 anni
28.014
-1.376
-4.68%
1 gen 1983 anni
27.205
-0.809
-2.89%
1 gen 1984 anni
26.345
-0.86
-3.16%
1 gen 1985 anni
25.219
-1.126
-4.27%
1 gen 1986 anni
22.812
-2.408
-9.55%
1 gen 1987 anni
20.11
-2.702
-11.84%
1 gen 1988 anni
18.841
-1.269
-6.31%
1 gen 1989 anni
17.472
-1.369
-7.26%
1 gen 1990 anni
16.159
-1.313
-7.52%
1 gen 1991 anni
16.058
-0.101
-0.62%
1 gen 1992 anni
15.691
-0.366
-2.28%
1 gen 1993 anni
15.717
+0.026
0.16%
1 gen 1994 anni
15.161
-0.557
-3.54%
1 gen 1995 anni
14.728
-0.433
-2.85%
1 gen 1996 anni
15.184
+0.456
3.09%
1 gen 1997 anni
14.813
-0.371
-2.44%
1 gen 1998 anni
14.808
-0.004
-0.03%
1 gen 1999 anni
13.945
-0.864
-5.83%
1 gen 2000 anni
12.374
-1.57
-11.26%
1 gen 2001 anni
11.299
-1.075
-8.69%
1 gen 2002 anni
10.626
-0.673
-5.96%
1 gen 2003 anni
9.252
-1.374
-12.93%
1 gen 2004 anni
6.645
-2.607
-28.18%
1 gen 2005 anni
5.753
-0.892
-13.43%
1 gen 2006 anni
6.169
+0.417
7.24%
1 gen 2007 anni
5.773
-0.396
-6.42%
1 gen 2008 anni
4.62
-1.153
-19.97%
1 gen 2009 anni
3.922
-0.698
-15.1%
1 gen 2010 anni
3.988
+0.066
1.69%
1 gen 2011 anni
3.654
-0.335
-8.39%
1 gen 2012 anni
3.592
-0.061
-1.67%
1 gen 2013 anni
3.585
-0.007
-0.2%
1 gen 2014 anni
3.695
+0.11
3.06%
1 gen 2015 anni
3.827
+0.132
3.57%
Classificazione dei paesi secondo i statistiche attuali per anni


Commenti: