29
/it/
it
AIzaSyAYiBZKx7MnpbEhh9jyipgxe19OcubqV5w
April 1, 2024
36099
High income
HIC
false
2
1
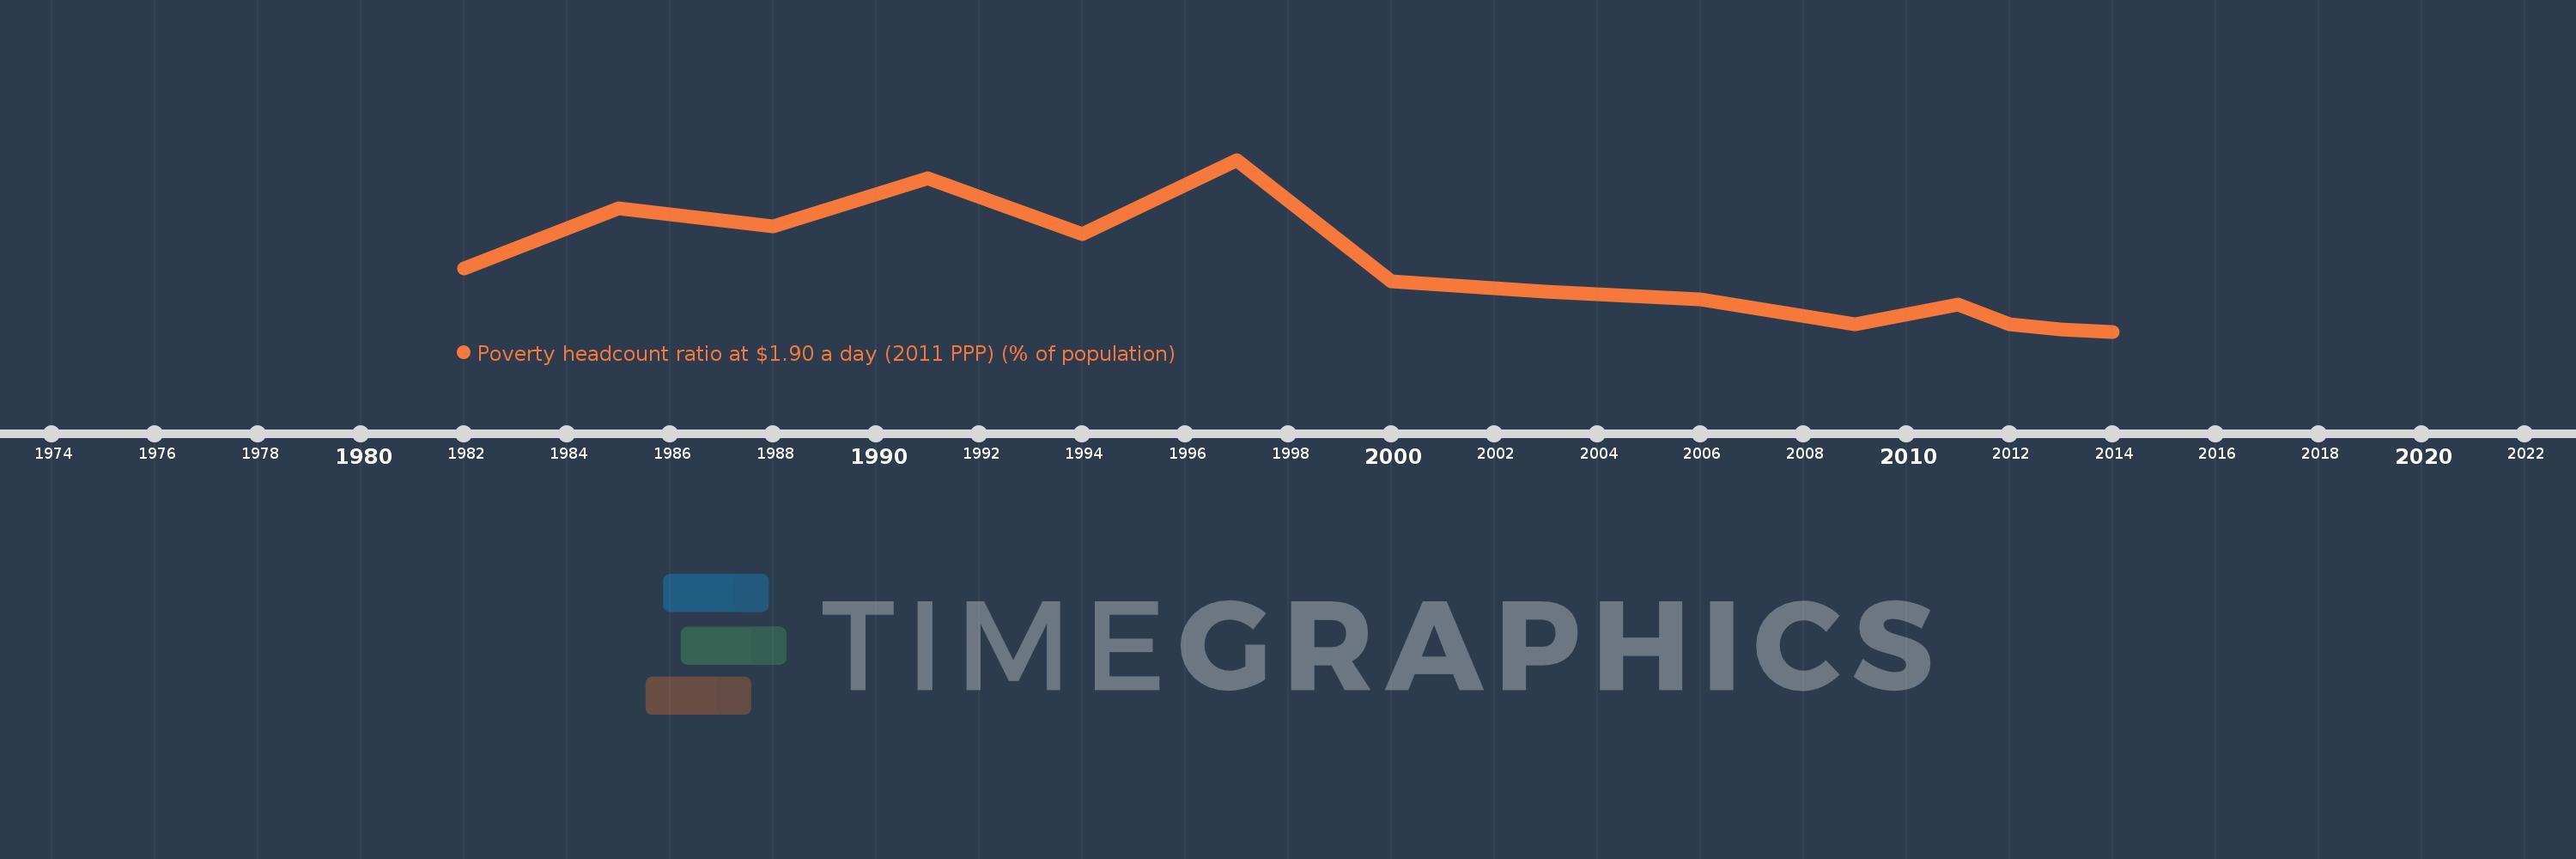
Poverty headcount ratio at $1.90 a day (2011 PPP) (% of population)
2014,2013,2012,2011,2009,2006,2003,2000,1997,1994,1991,1988,1985,1982
Queste statistiche in altri paesi:
Linea del tempo:
Questa scala temporale mostra un grafico dal 1982 anno al 2014 anno. High income. I dati fino ad 1981 anno non disponibili. Il numero di osservazioni attuali secondo i date: 14.
La fonte (nome):
Indicatori dello sviluppo mondiale
La fonte (organizzazione):
World Bank, Development Research Group. Data are based on primary household survey data obtained from government statistical agencies and World Bank country departments. Data for high-income economies are from the Luxembourg Income Study database. For more information and methodology, please see PovcalNet (http://iresearch.worldbank.org/PovcalNet/index.htm).
Categorie:
Poverty, Aid Effectiveness, Climate Change
sono stati aggiornati
23 apr 2017 anni
Indicatori delle variazioni dei valori per anni
Minima:
0.34
1 gen 2014 anni
Massimo:
1.73
1 gen 1997 anni
Alla data di osservazione
Valore
Variazione assoluta
La variazione rispetto al valore precedente
1 gen 1982 anni
0.85
+0.85
0.0%
1 gen 1985 anni
1.34
+0.49
57.65%
1 gen 1988 anni
1.19
-0.15
-11.19%
1 gen 1991 anni
1.58
+0.39
32.77%
1 gen 1994 anni
1.13
-0.45
-28.48%
1 gen 1997 anni
1.73
+0.6
53.1%
1 gen 2000 anni
0.75
-0.98
-56.65%
1 gen 2003 anni
0.66
-0.09
-12.0%
1 gen 2006 anni
0.6
-0.06
-9.09%
1 gen 2009 anni
0.4
-0.2
-33.33%
1 gen 2011 anni
0.56
+0.16
40.0%
1 gen 2012 anni
0.4
-0.16
-28.57%
1 gen 2013 anni
0.36
-0.04
-10.0%
1 gen 2014 anni
0.34
-0.02
-5.56%
Classificazione dei paesi secondo i statistiche attuali per anni


Commenti: