29
/it/
it
AIzaSyAYiBZKx7MnpbEhh9jyipgxe19OcubqV5w
April 1, 2024
35811
High income
HIC
false
2
1
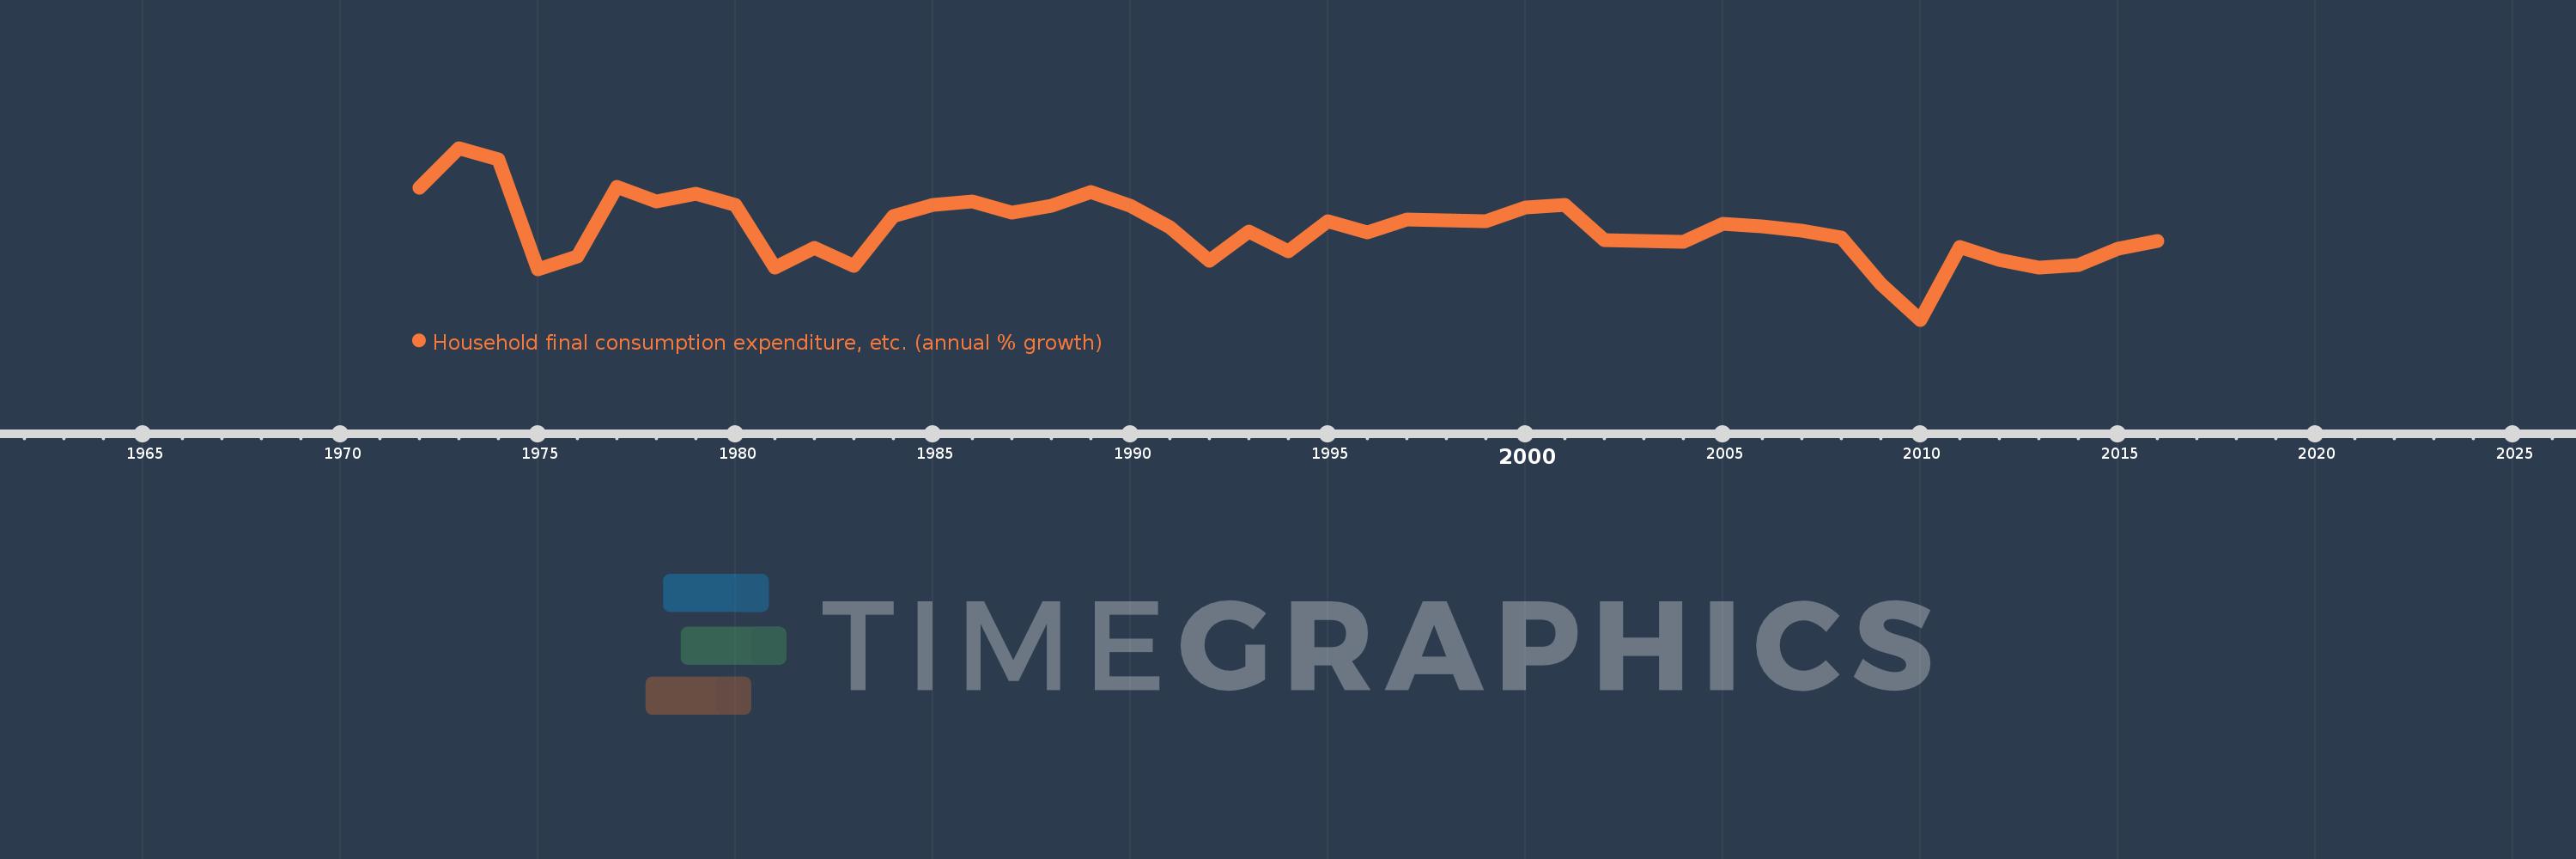
Household final consumption expenditure, etc. (annual % growth)
2016,2015,2014,2013,2012,2011,2010,2009,2008,2007,2006,2005,2004,2003,2002,2001,2000,1999,1998,1997,1996,1995,1994,1993,1992,1991,1990,1989,1988,1987,1986,1985,1984,1983,1982,1981,1980,1979,1978,1977,1976,1975,1974,1973,1972
Queste statistiche in altri paesi:
AlbaniaAlgeriaAntigua and BarbudaArab WorldArgentinaArmeniaAustraliaAustriaAzerbaijanBahamas, TheBahrainBangladeshBarbadosBelarusBelgiumBelizeBeninBhutanBoliviaBosnia and HerzegovinaBotswanaBrazilBrunei DarussalamBulgariaBurkina FasoBurundiCabo VerdeCambodiaCameroonCanadaCaribbean small statesCentral Europe and the BalticsChadChileColombiaComorosCongo, Dem. Rep.Congo, Rep.Costa RicaCote d'IvoireCroatiaCubaCyprusCzech RepublicDenmarkDjiboutiDominican RepublicEarly-demographic dividendEast Asia & PacificEcuadorEgypt, Arab Rep.El SalvadorEquatorial GuineaEritreaEstoniaEthiopiaEuro areaEurope & Central AsiaEurope & Central Asia (excluding high income)Europe & Central Asia (IDA & IBRD countries)European UnionFijiFinlandFranceGabonGambia, TheGeorgiaGermanyGhanaGreeceGuatemalaGuineaGuinea-BissauHaitiHeavily indebted poor countries (HIPC)High incomeHondurasHong Kong SAR, ChinaHungaryIBRD onlyIcelandIDA & IBRD totalIDA blendIDA onlyIDA totalIndiaIndonesiaIran, Islamic Rep.IrelandIsraelItalyJamaicaJapanJordanKazakhstanKenyaKorea, Rep.KosovoKuwaitKyrgyz RepublicLao PDRLatin America & Caribbean Latin America & Caribbean (excluding high income)Latin America & the Caribbean (IDA & IBRD countries)LatviaLeast developed countries: UN classificationLebanonLiberiaLithuaniaLow & middle incomeLow incomeLower middle incomeLuxembourgMacao SAR, ChinaMacedonia, FYRMadagascarMalawiMalaysiaMaliMaltaMarshall IslandsMauritaniaMauritiusMexicoMiddle East & North AfricaMiddle East & North Africa (excluding high income)Middle East & North Africa (IDA & IBRD countries)Middle incomeMoldovaMongoliaMontenegroMoroccoMozambiqueNamibiaNepalNetherlandsNew ZealandNicaraguaNigerNigeriaNorth AmericaNorwayOECD membersOmanOther small statesPakistanPanamaPapua New GuineaParaguayPeruPhilippinesPolandPortugalPost-demographic dividendPre-demographic dividendPuerto RicoQatarRomaniaRussian FederationRwandaSaudi ArabiaSenegalSerbiaSeychellesSierra LeoneSingaporeSlovak RepublicSloveniaSmall statesSomaliaSouth AfricaSouth AsiaSouth Asia (IDA & IBRD)South SudanSpainSri LankaSub-Saharan Africa Sub-Saharan Africa (excluding high income)Sub-Saharan Africa (IDA & IBRD countries)SudanSurinameSwazilandSwedenSwitzerlandSyrian Arab RepublicTajikistanTanzaniaThailandTimor-LesteTogoTrinidad and TobagoTunisiaTurkeyTurkmenistanUgandaUkraineUnited Arab EmiratesUnited KingdomUnited StatesUpper middle incomeUruguayVanuatuVenezuela, RBVietnamWest Bank and GazaWorldZambiaZimbabwe Linea del tempo:
Questa scala temporale mostra un grafico dal 1972 anno al 2016 anno. High income. I dati fino ad 1971 anno non disponibili. Il numero di osservazioni attuali secondo i date: 45.
La fonte (nome):
Indicatori dello sviluppo mondiale
La fonte (organizzazione):
World Bank national accounts data, and OECD National Accounts data files.
Categorie:
Economy & Growth
sono stati aggiornati
23 apr 2017 anni
Indicatori delle variazioni dei valori per anni
Minima:
-1.457
1 gen 2010 anni
Massimo:
6.576
1 gen 1973 anni
Alla data di osservazione
Valore
Variazione assoluta
La variazione rispetto al valore precedente
1 gen 1972 anni
4.709
+4.709
0.0%
1 gen 1973 anni
6.576
+1.867
39.65%
1 gen 1974 anni
6.059
-0.517
-7.86%
1 gen 1975 anni
0.884
-5.175
-85.41%
1 gen 1976 anni
1.505
+0.621
70.22%
1 gen 1977 anni
4.751
+3.246
215.72%
1 gen 1978 anni
4.064
-0.687
-14.46%
1 gen 1979 anni
4.446
+0.382
9.4%
1 gen 1980 anni
3.908
-0.538
-12.1%
1 gen 1981 anni
0.979
-2.929
-74.96%
1 gen 1982 anni
1.885
+0.906
92.57%
1 gen 1983 anni
1.045
-0.839
-44.53%
1 gen 1984 anni
3.396
+2.35
224.83%
1 gen 1985 anni
3.915
+0.519
15.3%
1 gen 1986 anni
4.059
+0.144
3.67%
1 gen 1987 anni
3.547
-0.512
-12.62%
1 gen 1988 anni
3.865
+0.319
8.99%
1 gen 1989 anni
4.529
+0.663
17.16%
1 gen 1990 anni
3.865
-0.664
-14.66%
1 gen 1991 anni
2.876
-0.989
-25.59%
1 gen 1992 anni
1.303
-1.573
-54.69%
1 gen 1993 anni
2.668
+1.366
104.81%
1 gen 1994 anni
1.74
-0.928
-34.78%
1 gen 1995 anni
3.166
+1.426
81.94%
1 gen 1996 anni
2.617
-0.549
-17.34%
1 gen 1997 anni
3.24
+0.622
23.77%
1 gen 1998 anni
3.178
-0.061
-1.89%
1 gen 1999 anni
3.13
-0.048
-1.52%
1 gen 2000 anni
3.801
+0.671
21.44%
1 gen 2001 anni
3.923
+0.122
3.21%
1 gen 2002 anni
2.275
-1.647
-42.0%
1 gen 2003 anni
2.232
-0.044
-1.93%
1 gen 2004 anni
2.194
-0.038
-1.68%
1 gen 2005 anni
3.032
+0.838
38.18%
1 gen 2006 anni
2.89
-0.142
-4.68%
1 gen 2007 anni
2.698
-0.191
-6.62%
1 gen 2008 anni
2.379
-0.319
-11.83%
1 gen 2009 anni
0.213
-2.166
-91.05%
1 gen 2010 anni
-1.457
-1.67
-784.0%
1 gen 2011 anni
1.937
+3.394
-232.98%
1 gen 2012 anni
1.348
-0.589
-30.42%
1 gen 2013 anni
0.967
-0.381
-28.29%
1 gen 2014 anni
1.106
+0.14
14.44%
1 gen 2015 anni
1.853
+0.747
67.52%
1 gen 2016 anni
2.229
+0.376
20.29%
Classificazione dei paesi secondo i statistiche attuali per anni


Commenti: