29
/it/
it
AIzaSyAYiBZKx7MnpbEhh9jyipgxe19OcubqV5w
April 1, 2024
35694
High income
HIC
false
2
1
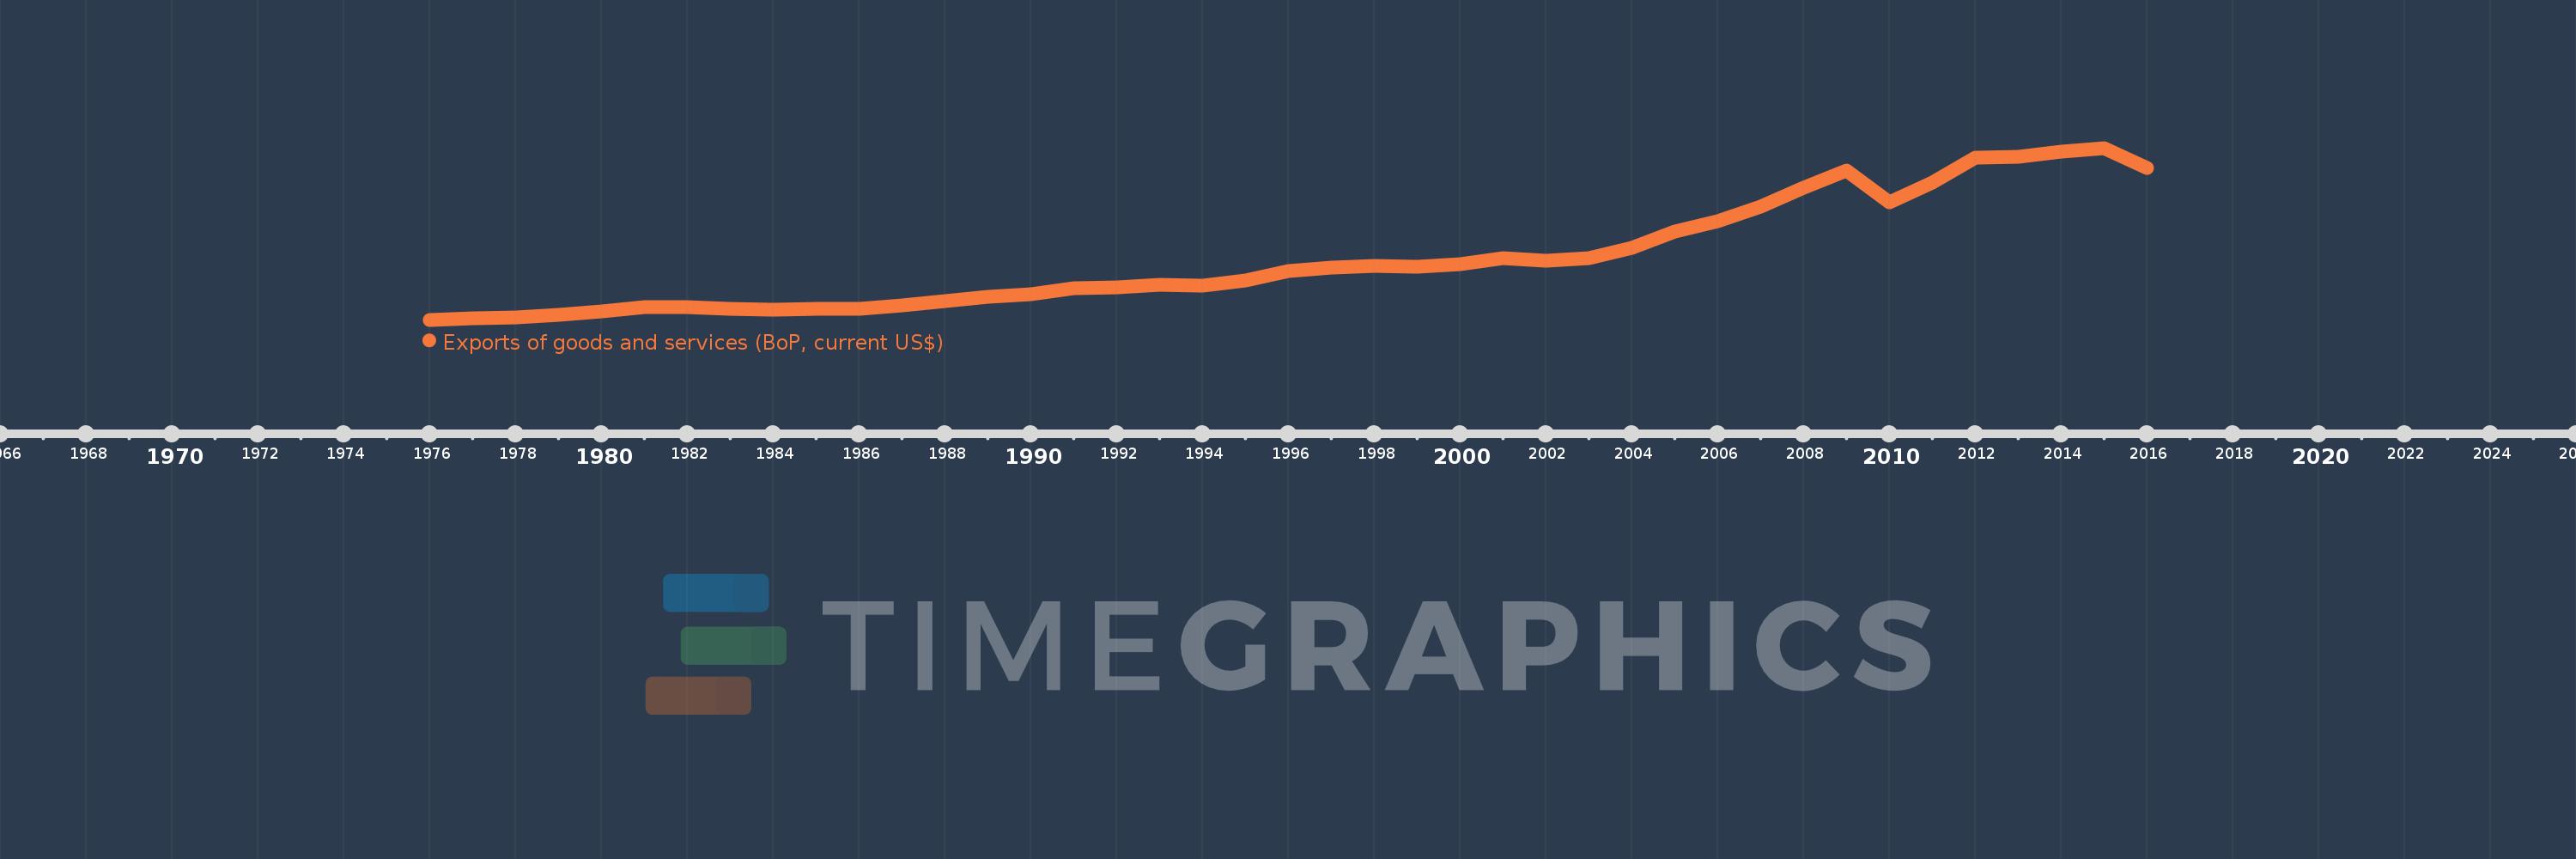
Exports of goods and services (BoP, current US$)
2016,2015,2014,2013,2012,2011,2010,2009,2008,2007,2006,2005,2004,2003,2002,2001,2000,1999,1998,1997,1996,1995,1994,1993,1992,1991,1990,1989,1988,1987,1986,1985,1984,1983,1982,1981,1980,1979,1978,1977,1976
Queste statistiche in altri paesi:
AfghanistanAlbaniaAlgeriaAngolaAntigua and BarbudaArab WorldArgentinaArmeniaArubaAustraliaAustriaAzerbaijanBahamas, TheBahrainBangladeshBarbadosBelarusBelgiumBelizeBeninBermudaBhutanBoliviaBosnia and HerzegovinaBotswanaBrazilBrunei DarussalamBulgariaBurkina FasoBurundiCabo VerdeCambodiaCameroonCanadaCaribbean small statesCentral African RepublicCentral Europe and the BalticsChadChileChinaColombiaComorosCongo, Dem. Rep.Congo, Rep.Costa RicaCote d'IvoireCroatiaCuracaoCyprusCzech RepublicDenmarkDjiboutiDominicaDominican RepublicEarly-demographic dividendEast Asia & PacificEast Asia & Pacific (excluding high income)East Asia & Pacific (IDA & IBRD countries)EcuadorEgypt, Arab Rep.El SalvadorEquatorial GuineaEritreaEstoniaEthiopiaEuro areaEurope & Central AsiaEurope & Central Asia (excluding high income)Europe & Central Asia (IDA & IBRD countries)European UnionFaroe IslandsFijiFinlandFragile and conflict affected situationsFranceFrench PolynesiaGabonGambia, TheGeorgiaGermanyGhanaGreeceGrenadaGuatemalaGuineaGuinea-BissauGuyanaHaitiHeavily indebted poor countries (HIPC)High incomeHondurasHong Kong SAR, ChinaHungaryIBRD onlyIcelandIDA & IBRD totalIDA blendIDA onlyIDA totalIndiaIndonesiaIran, Islamic Rep.IraqIrelandIsraelItalyJamaicaJapanJordanKazakhstanKenyaKiribatiKorea, Rep.KosovoKuwaitKyrgyz RepublicLao PDRLate-demographic dividendLatin America & Caribbean Latin America & Caribbean (excluding high income)Latin America & the Caribbean (IDA & IBRD countries)LatviaLeast developed countries: UN classificationLebanonLesothoLiberiaLibyaLithuaniaLow & middle incomeLow incomeLower middle incomeLuxembourgMacao SAR, ChinaMacedonia, FYRMadagascarMalawiMalaysiaMaldivesMaliMaltaMarshall IslandsMauritaniaMauritiusMexicoMicronesia, Fed. Sts.Middle East & North Africa (excluding high income)Middle East & North Africa (IDA & IBRD countries)Middle incomeMoldovaMongoliaMontenegroMoroccoMozambiqueMyanmarNamibiaNepalNetherlandsNew CaledoniaNicaraguaNigerNigeriaNorth AmericaNorwayOECD membersOmanPacific island small statesPakistanPalauPanamaPapua New GuineaParaguayPeruPhilippinesPolandPortugalPost-demographic dividendPre-demographic dividendQatarRomaniaRussian FederationRwandaSamoaSao Tome and PrincipeSaudi ArabiaSenegalSerbiaSeychellesSierra LeoneSingaporeSint Maarten (Dutch part)Slovak RepublicSloveniaSolomon IslandsSouth AfricaSouth AsiaSouth Asia (IDA & IBRD)South SudanSpainSri LankaSt. Kitts and NevisSt. LuciaSt. Vincent and the GrenadinesSub-Saharan Africa Sub-Saharan Africa (excluding high income)Sub-Saharan Africa (IDA & IBRD countries)SudanSurinameSwazilandSwedenSwitzerlandSyrian Arab RepublicTajikistanTanzaniaThailandTimor-LesteTogoTongaTrinidad and TobagoTunisiaTurkeyTuvaluUgandaUkraineUnited KingdomUnited StatesUpper middle incomeUruguayVanuatuVenezuela, RBVietnamWest Bank and GazaWorldYemen, Rep.ZambiaZimbabwe Linea del tempo:
Questa scala temporale mostra un grafico dal 1976 anno al 2016 anno. High income. I dati fino ad 1975 anno non disponibili. Il numero di osservazioni attuali secondo i date: 41.
La fonte (nome):
Indicatori dello sviluppo mondiale
La fonte (organizzazione):
International Monetary Fund, Balance of Payments Statistics Yearbook and data files.
Categorie:
Economy & Growth, Trade
sono stati aggiornati
23 apr 2017 anni
Indicatori delle variazioni dei valori per anni
Minima:
880.862 Mlrd
1 gen 1976 anni
Massimo:
16.519 Trln
1 gen 2015 anni
Alla data di osservazione
Valore
Variazione assoluta
La variazione rispetto al valore precedente
1 gen 1976 anni
880.862 Mlrd
+880.862 Mlrd
0.0%
1 gen 1977 anni
982.789 Mlrd
+101.927 Mlrd
11.57%
1 gen 1978 anni
1.114 Trln
+130.969 Mlrd
13.33%
1 gen 1979 anni
1.32 Trln
+206.43 Mlrd
18.53%
1 gen 1980 anni
1.668 Trln
+347.722 Mlrd
26.34%
1 gen 1981 anni
1.999 Trln
+330.807 Mlrd
19.83%
1 gen 1982 anni
1.998 Trln
-284.527 Mln
-0.01%
1 gen 1983 anni
1.856 Trln
-142.9 Mlrd
-7.15%
1 gen 1984 anni
1.787 Trln
-68.514 Mlrd
-3.69%
1 gen 1985 anni
1.861 Trln
+73.698 Mlrd
4.12%
1 gen 1986 anni
1.896 Trln
+34.814 Mlrd
1.87%
1 gen 1987 anni
2.186 Trln
+290.079 Mlrd
15.3%
1 gen 1988 anni
2.588 Trln
+402.758 Mlrd
18.43%
1 gen 1989 anni
2.958 Trln
+369.35 Mlrd
14.27%
1 gen 1990 anni
3.195 Trln
+236.884 Mlrd
8.01%
1 gen 1991 anni
3.733 Trln
+537.906 Mlrd
16.84%
1 gen 1992 anni
3.811 Trln
+78.965 Mlrd
2.12%
1 gen 1993 anni
4.097 Trln
+285.331 Mlrd
7.49%
1 gen 1994 anni
3.983 Trln
-113.426 Mlrd
-2.77%
1 gen 1995 anni
4.439 Trln
+455.817 Mlrd
11.44%
1 gen 1996 anni
5.325 Trln
+885.897 Mlrd
19.96%
1 gen 1997 anni
5.603 Trln
+278.156 Mlrd
5.22%
1 gen 1998 anni
5.774 Trln
+170.629 Mlrd
3.05%
1 gen 1999 anni
5.733 Trln
-40.766 Mlrd
-0.71%
1 gen 2000 anni
5.934 Trln
+200.979 Mlrd
3.51%
1 gen 2001 anni
6.489 Trln
+554.907 Mlrd
9.35%
1 gen 2002 anni
6.23 Trln
-259.003 Mlrd
-3.99%
1 gen 2003 anni
6.454 Trln
+224.485 Mlrd
3.6%
1 gen 2004 anni
7.421 Trln
+966.904 Mlrd
14.98%
1 gen 2005 anni
8.928 Trln
+1.506 Trln
20.3%
1 gen 2006 anni
9.88 Trln
+952.197 Mlrd
10.67%
1 gen 2007 anni
11.17 Trln
+1.29 Trln
13.06%
1 gen 2008 anni
12.869 Trln
+1.699 Trln
15.21%
1 gen 2009 anni
14.432 Trln
+1.562 Trln
12.14%
1 gen 2010 anni
11.571 Trln
-2.86 Trln
-19.82%
1 gen 2011 anni
13.402 Trln
+1.831 Trln
15.83%
1 gen 2012 anni
15.668 Trln
+2.265 Trln
16.9%
1 gen 2013 anni
15.7 Trln
+32.145 Mlrd
0.21%
1 gen 2014 anni
16.176 Trln
+476.138 Mlrd
3.03%
1 gen 2015 anni
16.519 Trln
+343.028 Mlrd
2.12%
1 gen 2016 anni
14.685 Trln
-1.834 Trln
-11.1%
Classificazione dei paesi secondo i statistiche attuali per anni


Commenti: