29
/it/
it
AIzaSyAYiBZKx7MnpbEhh9jyipgxe19OcubqV5w
April 1, 2024
35568
High income
HIC
false
2
1
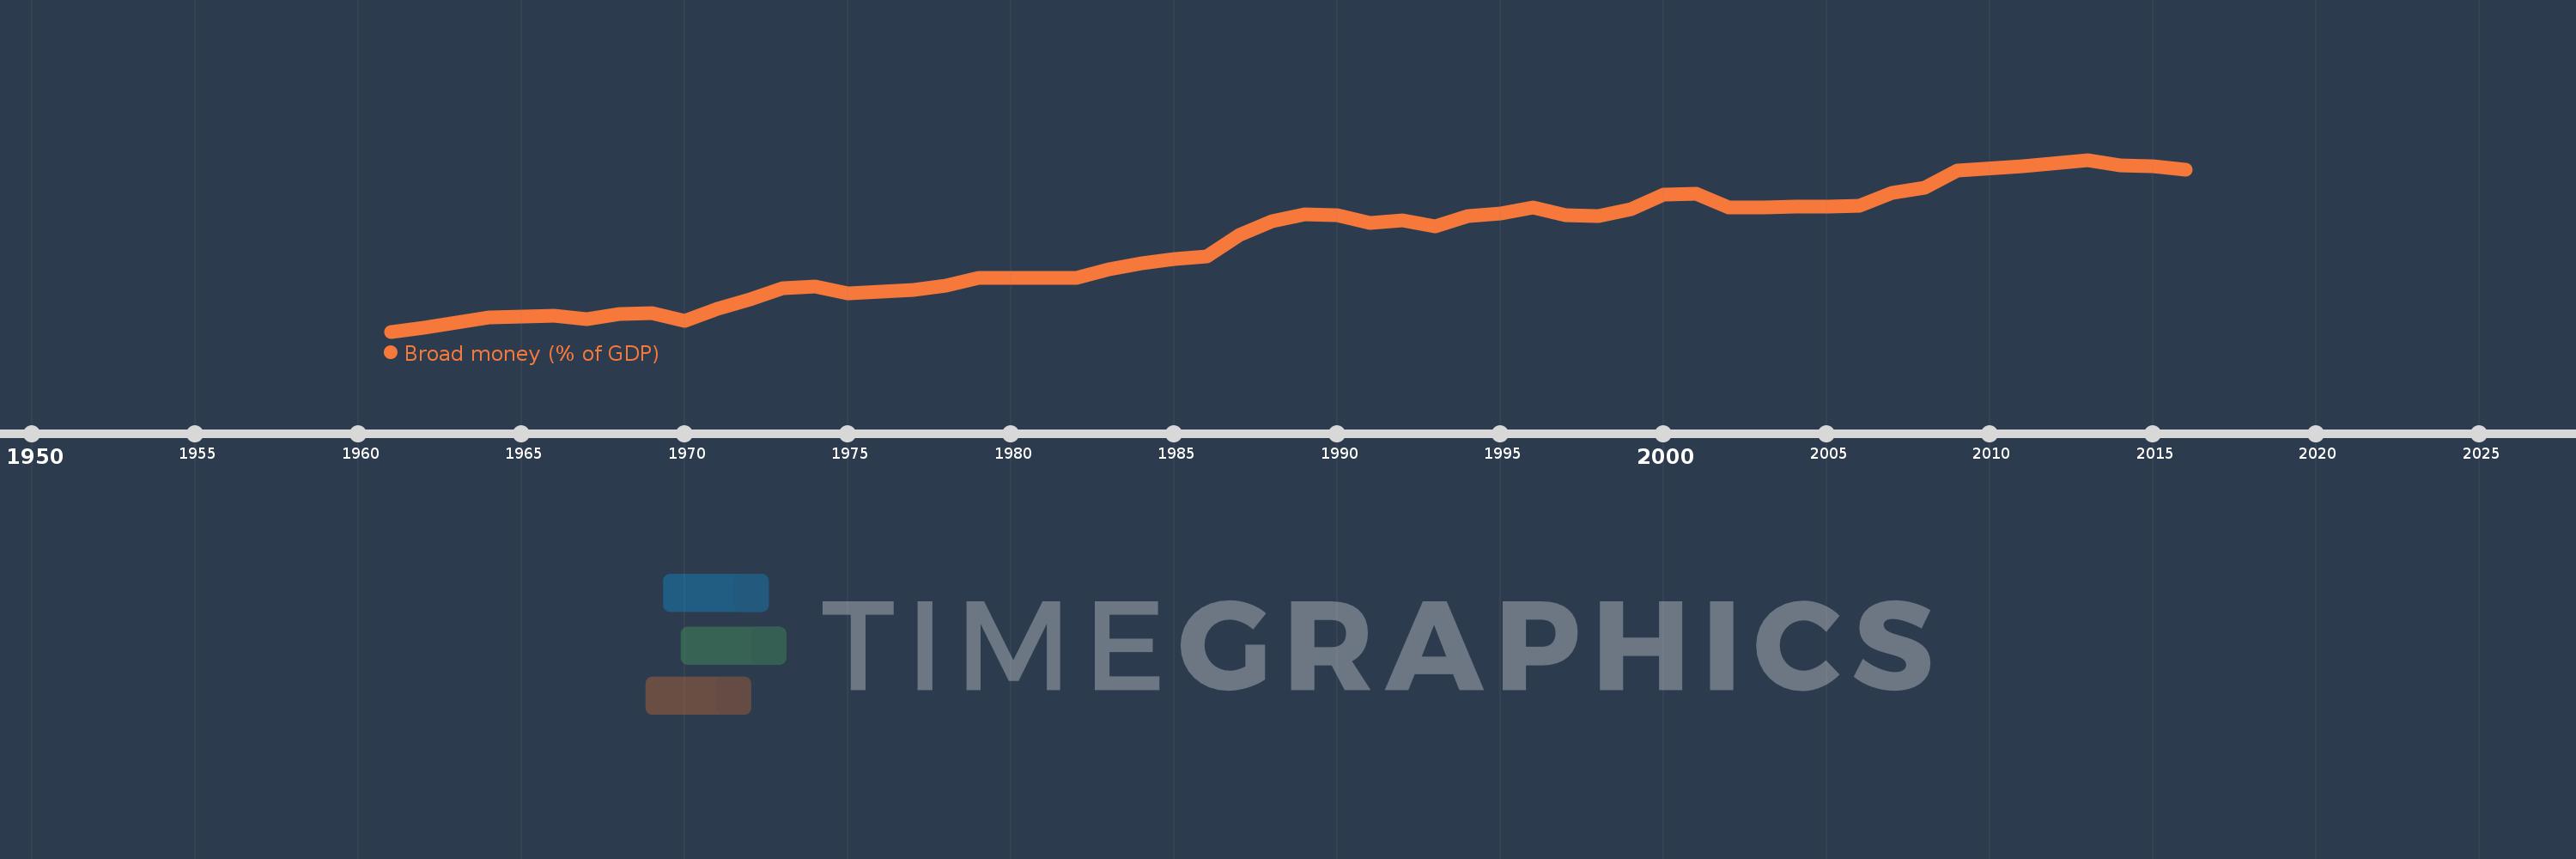
Broad money (% of GDP)
2016,2015,2014,2013,2011,2009,2008,2007,2006,2005,2004,2003,2002,2001,2000,1999,1998,1997,1996,1995,1994,1993,1992,1991,1990,1989,1988,1987,1986,1985,1984,1983,1982,1979,1978,1977,1975,1974,1973,1972,1971,1970,1969,1968,1967,1966,1965,1964,1963,1962,1961
Queste statistiche in altri paesi:
AfghanistanAlbaniaAlgeriaAngolaAntigua and BarbudaArab WorldArgentinaArmeniaArubaAustraliaAzerbaijanBahamas, TheBahrainBangladeshBarbadosBelarusBelizeBeninBhutanBoliviaBosnia and HerzegovinaBotswanaBrazilBrunei DarussalamBulgariaBurkina FasoBurundiCabo VerdeCambodiaCameroonCanadaCaribbean small statesCentral African RepublicCentral Europe and the BalticsChadChileChinaColombiaComorosCongo, Dem. Rep.Congo, Rep.Costa RicaCote d'IvoireCroatiaCzech RepublicDenmarkDjiboutiDominicaDominican RepublicEarly-demographic dividendEast Asia & PacificEast Asia & Pacific (excluding high income)East Asia & Pacific (IDA & IBRD countries)EcuadorEgypt, Arab Rep.El SalvadorEquatorial GuineaEritreaEstoniaEthiopiaEurope & Central Asia (excluding high income)Europe & Central Asia (IDA & IBRD countries)FijiFragile and conflict affected situationsGabonGambia, TheGeorgiaGhanaGrenadaGuatemalaGuineaGuinea-BissauGuyanaHaitiHeavily indebted poor countries (HIPC)High incomeHondurasHong Kong SAR, ChinaHungaryIBRD onlyIcelandIDA & IBRD totalIDA blendIDA onlyIDA totalIndiaIndonesiaIran, Islamic Rep.IraqIsraelJamaicaJapanJordanKazakhstanKenyaKorea, Rep.KuwaitKyrgyz RepublicLao PDRLate-demographic dividendLatin America & Caribbean Latin America & Caribbean (excluding high income)Latin America & the Caribbean (IDA & IBRD countries)LatviaLeast developed countries: UN classificationLebanonLesothoLiberiaLibyaLithuaniaLow & middle incomeLow incomeLower middle incomeMacao SAR, ChinaMacedonia, FYRMadagascarMalawiMalaysiaMaldivesMaliMauritaniaMauritiusMexicoMicronesia, Fed. Sts.Middle East & North AfricaMiddle East & North Africa (excluding high income)Middle East & North Africa (IDA & IBRD countries)Middle incomeMoldovaMongoliaMoroccoMozambiqueMyanmarNamibiaNepalNew ZealandNicaraguaNigerNigeriaNorth AmericaNorwayOECD membersOmanOther small statesPacific island small statesPakistanPanamaPapua New GuineaParaguayPeruPhilippinesPolandPost-demographic dividendPre-demographic dividendQatarRomaniaRussian FederationRwandaSamoaSao Tome and PrincipeSaudi ArabiaSenegalSerbiaSeychellesSierra LeoneSingaporeSlovak RepublicSmall statesSolomon IslandsSouth AfricaSouth AsiaSouth Asia (IDA & IBRD)South SudanSri LankaSt. Kitts and NevisSt. LuciaSt. Vincent and the GrenadinesSub-Saharan Africa Sub-Saharan Africa (excluding high income)Sub-Saharan Africa (IDA & IBRD countries)SudanSurinameSwazilandSwedenSwitzerlandSyrian Arab RepublicTajikistanTanzaniaThailandTimor-LesteTogoTongaTrinidad and TobagoTunisiaTurkeyUgandaUkraineUnited Arab EmiratesUnited KingdomUnited StatesUpper middle incomeUruguayVanuatuVenezuela, RBVietnamWest Bank and GazaWorldYemen, Rep.ZambiaZimbabwe Linea del tempo:
Questa scala temporale mostra un grafico dal 1961 anno al 2016 anno. High income. I dati fino ad 1960 anno non disponibili. Il numero di osservazioni attuali secondo i date: 51.
La fonte (nome):
Indicatori dello sviluppo mondiale
La fonte (organizzazione):
International Monetary Fund, International Financial Statistics and data files, and World Bank and OECD GDP estimates.
Categorie:
Financial Sector
sono stati aggiornati
23 apr 2017 anni
Indicatori delle variazioni dei valori per anni
Minima:
55.405
1 gen 1961 anni
Massimo:
124.11
1 gen 2013 anni
Alla data di osservazione
Valore
Variazione assoluta
La variazione rispetto al valore precedente
1 gen 1961 anni
55.405
+55.405
0.0%
1 gen 1962 anni
57.101
+1.696
3.06%
1 gen 1963 anni
59.023
+1.922
3.37%
1 gen 1964 anni
61.098
+2.075
3.52%
1 gen 1965 anni
61.501
+0.402
0.66%
1 gen 1966 anni
61.916
+0.416
0.68%
1 gen 1967 anni
60.276
-1.64
-2.65%
1 gen 1968 anni
62.541
+2.265
3.76%
1 gen 1969 anni
62.629
+0.087
0.14%
1 gen 1970 anni
59.599
-3.03
-4.84%
1 gen 1971 anni
64.485
+4.886
8.2%
1 gen 1972 anni
68.142
+3.657
5.67%
1 gen 1973 anni
72.741
+4.598
6.75%
1 gen 1974 anni
73.386
+0.645
0.89%
1 gen 1975 anni
70.665
-2.721
-3.71%
1 gen 1977 anni
72.067
+1.403
1.99%
1 gen 1978 anni
73.835
+1.768
2.45%
1 gen 1979 anni
76.982
+3.147
4.26%
1 gen 1982 anni
76.992
+0.01
0.01%
1 gen 1983 anni
80.175
+3.182
4.13%
1 gen 1984 anni
82.699
+2.524
3.15%
1 gen 1985 anni
84.326
+1.627
1.97%
1 gen 1986 anni
85.465
+1.139
1.35%
1 gen 1987 anni
94.151
+8.686
10.16%
1 gen 1988 anni
99.698
+5.546
5.89%
1 gen 1989 anni
102.229
+2.531
2.54%
1 gen 1990 anni
101.845
-0.383
-0.38%
1 gen 1991 anni
98.791
-3.054
-3.0%
1 gen 1992 anni
100.054
+1.262
1.28%
1 gen 1993 anni
97.507
-2.547
-2.55%
1 gen 1994 anni
101.499
+3.992
4.09%
1 gen 1995 anni
102.507
+1.008
0.99%
1 gen 1996 anni
105.129
+2.621
2.56%
1 gen 1997 anni
101.916
-3.212
-3.06%
1 gen 1998 anni
101.756
-0.161
-0.16%
1 gen 1999 anni
104.409
+2.653
2.61%
1 gen 2000 anni
110.042
+5.633
5.4%
1 gen 2001 anni
110.685
+0.643
0.58%
1 gen 2002 anni
105.187
-5.498
-4.97%
1 gen 2003 anni
104.992
-0.195
-0.19%
1 gen 2004 anni
105.453
+0.462
0.44%
1 gen 2005 anni
105.508
+0.055
0.05%
1 gen 2006 anni
105.604
+0.096
0.09%
1 gen 2007 anni
110.778
+5.174
4.9%
1 gen 2008 anni
113.025
+2.247
2.03%
1 gen 2009 anni
119.909
+6.884
6.09%
1 gen 2011 anni
121.39
+1.482
1.24%
1 gen 2013 anni
124.11
+2.72
2.24%
1 gen 2014 anni
121.798
-2.312
-1.86%
1 gen 2015 anni
121.404
-0.394
-0.32%
1 gen 2016 anni
120.3
-1.104
-0.91%
Classificazione dei paesi secondo i statistiche attuali per anni


Commenti: