29
/it/
it
AIzaSyAYiBZKx7MnpbEhh9jyipgxe19OcubqV5w
April 1, 2024
35527
High income
HIC
false
2
1
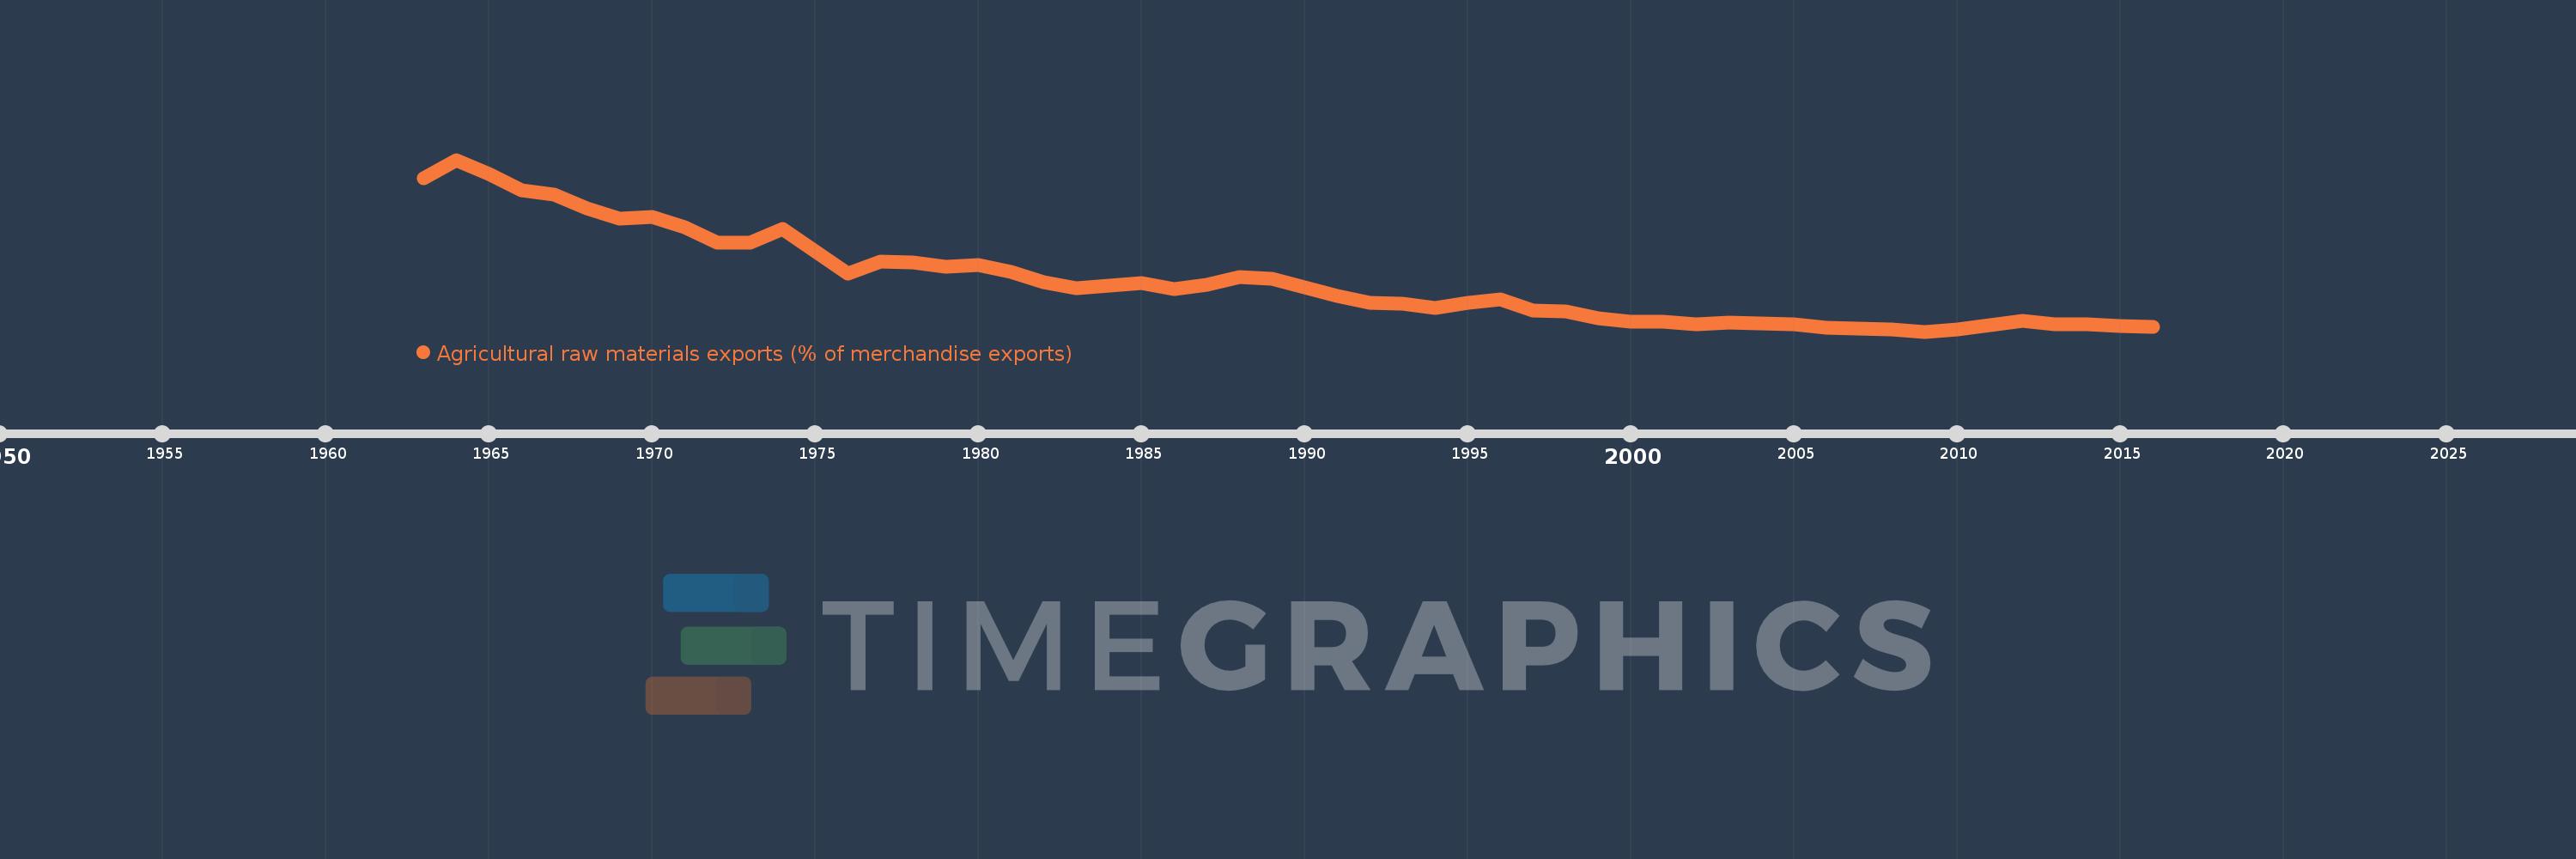
Agricultural raw materials exports (% of merchandise exports)
2016,2015,2014,2013,2012,2011,2010,2009,2008,2007,2006,2005,2004,2003,2002,2001,2000,1999,1998,1997,1996,1995,1994,1993,1992,1991,1990,1989,1988,1987,1986,1985,1984,1983,1982,1981,1980,1979,1978,1977,1976,1975,1974,1973,1972,1971,1970,1969,1968,1967,1966,1965,1964,1963
Queste statistiche in altri paesi:
AfghanistanAlbaniaAlgeriaAndorraAngolaAntigua and BarbudaArab WorldArgentinaArmeniaArubaAustraliaAustriaAzerbaijanBahamas, TheBahrainBangladeshBarbadosBelarusBelgiumBelizeBeninBermudaBhutanBoliviaBosnia and HerzegovinaBotswanaBrazilBrunei DarussalamBulgariaBurkina FasoBurundiCabo VerdeCambodiaCameroonCanadaCaribbean small statesCayman IslandsCentral African RepublicCentral Europe and the BalticsChadChileChinaColombiaComorosCongo, Dem. Rep.Congo, Rep.Costa RicaCote d'IvoireCroatiaCubaCyprusCzech RepublicDenmarkDjiboutiDominicaDominican RepublicEarly-demographic dividendEast Asia & PacificEast Asia & Pacific (excluding high income)East Asia & Pacific (IDA & IBRD countries)EcuadorEgypt, Arab Rep.El SalvadorEquatorial GuineaEritreaEstoniaEthiopiaEuro areaEurope & Central AsiaEurope & Central Asia (excluding high income)Europe & Central Asia (IDA & IBRD countries)European UnionFaroe IslandsFijiFinlandFragile and conflict affected situationsFranceFrench PolynesiaGabonGambia, TheGeorgiaGermanyGhanaGreeceGreenlandGrenadaGuatemalaGuineaGuinea-BissauGuyanaHaitiHeavily indebted poor countries (HIPC)High incomeHondurasHong Kong SAR, ChinaHungaryIBRD onlyIcelandIDA & IBRD totalIDA blendIDA onlyIDA totalIndiaIndonesiaIran, Islamic Rep.IraqIrelandIsraelItalyJamaicaJapanJordanKazakhstanKenyaKiribatiKorea, Rep.KuwaitKyrgyz RepublicLao PDRLate-demographic dividendLatin America & Caribbean Latin America & Caribbean (excluding high income)Latin America & the Caribbean (IDA & IBRD countries)LatviaLeast developed countries: UN classificationLebanonLesothoLiberiaLibyaLithuaniaLow & middle incomeLower middle incomeLuxembourgMacao SAR, ChinaMacedonia, FYRMadagascarMalawiMalaysiaMaldivesMaliMaltaMauritaniaMauritiusMexicoMiddle East & North AfricaMiddle East & North Africa (excluding high income)Middle East & North Africa (IDA & IBRD countries)Middle incomeMoldovaMongoliaMoroccoMozambiqueMyanmarNamibiaNepalNetherlandsNew CaledoniaNew ZealandNicaraguaNigerNigeriaNorth AmericaNorwayOECD membersOmanOther small statesPacific island small statesPakistanPalauPanamaPapua New GuineaParaguayPeruPhilippinesPolandPortugalPost-demographic dividendPre-demographic dividendQatarRomaniaRussian FederationRwandaSamoaSao Tome and PrincipeSaudi ArabiaSenegalSerbiaSeychellesSierra LeoneSingaporeSlovak RepublicSloveniaSmall statesSolomon IslandsSomaliaSouth AfricaSouth AsiaSouth Asia (IDA & IBRD)SpainSri LankaSt. Kitts and NevisSt. LuciaSt. Vincent and the GrenadinesSub-Saharan Africa Sub-Saharan Africa (excluding high income)Sub-Saharan Africa (IDA & IBRD countries)SudanSurinameSwazilandSwedenSwitzerlandSyrian Arab RepublicTajikistanTanzaniaThailandTimor-LesteTogoTongaTrinidad and TobagoTunisiaTurkeyTurkmenistanTurks and Caicos IslandsTuvaluUgandaUkraineUnited Arab EmiratesUnited KingdomUnited StatesUpper middle incomeUruguayVanuatuVenezuela, RBVietnamVirgin Islands (U.S.)WorldYemen, Rep.ZambiaZimbabwe Linea del tempo:
Questa scala temporale mostra un grafico dal 1963 anno al 2016 anno. High income. I dati fino ad 1962 anno non disponibili. Il numero di osservazioni attuali secondo i date: 54.
La fonte (nome):
Indicatori dello sviluppo mondiale
La fonte (organizzazione):
World Bank staff estimates from the Comtrade database maintained by the United Nations Statistics Division.
Categorie:
Agriculture & Rural Development, Private Sector, Trade
sono stati aggiornati
23 apr 2017 anni
Indicatori delle variazioni dei valori per anni
Minima:
1.349
1 gen 2009 anni
Massimo:
7.706
1 gen 1964 anni
Alla data di osservazione
Valore
Variazione assoluta
La variazione rispetto al valore precedente
1 gen 1963 anni
7.017
+7.017
0.0%
1 gen 1964 anni
7.706
+0.689
9.82%
1 gen 1965 anni
7.176
-0.529
-6.87%
1 gen 1966 anni
6.564
-0.612
-8.53%
1 gen 1967 anni
6.434
-0.13
-1.99%
1 gen 1968 anni
5.925
-0.508
-7.9%
1 gen 1969 anni
5.515
-0.41
-6.92%
1 gen 1970 anni
5.592
+0.077
1.4%
1 gen 1971 anni
5.213
-0.379
-6.79%
1 gen 1972 anni
4.625
-0.588
-11.28%
1 gen 1973 anni
4.632
+0.008
0.16%
1 gen 1974 anni
5.162
+0.529
11.42%
1 gen 1975 anni
4.318
-0.844
-16.35%
1 gen 1976 anni
3.488
-0.829
-19.21%
1 gen 1977 anni
3.954
+0.466
13.37%
1 gen 1978 anni
3.923
-0.032
-0.8%
1 gen 1979 anni
3.741
-0.182
-4.63%
1 gen 1980 anni
3.799
+0.058
1.54%
1 gen 1981 anni
3.546
-0.253
-6.66%
1 gen 1982 anni
3.178
-0.368
-10.37%
1 gen 1983 anni
2.948
-0.23
-7.25%
1 gen 1984 anni
3.044
+0.096
3.27%
1 gen 1985 anni
3.158
+0.114
3.74%
1 gen 1986 anni
2.91
-0.248
-7.85%
1 gen 1987 anni
3.088
+0.178
6.12%
1 gen 1988 anni
3.352
+0.264
8.54%
1 gen 1989 anni
3.296
-0.056
-1.67%
1 gen 1990 anni
2.976
-0.319
-9.69%
1 gen 1991 anni
2.681
-0.295
-9.91%
1 gen 1992 anni
2.416
-0.265
-9.9%
1 gen 1993 anni
2.395
-0.021
-0.89%
1 gen 1994 anni
2.22
-0.175
-7.3%
1 gen 1995 anni
2.425
+0.205
9.23%
1 gen 1996 anni
2.531
+0.106
4.36%
1 gen 1997 anni
2.122
-0.408
-16.14%
1 gen 1998 anni
2.082
-0.04
-1.91%
1 gen 1999 anni
1.853
-0.229
-10.99%
1 gen 2000 anni
1.728
-0.125
-6.76%
1 gen 2001 anni
1.724
-0.003
-0.2%
1 gen 2002 anni
1.632
-0.092
-5.36%
1 gen 2003 anni
1.678
+0.046
2.82%
1 gen 2004 anni
1.657
-0.021
-1.25%
1 gen 2005 anni
1.624
-0.033
-2.01%
1 gen 2006 anni
1.501
-0.123
-7.55%
1 gen 2007 anni
1.468
-0.033
-2.19%
1 gen 2008 anni
1.442
-0.026
-1.8%
1 gen 2009 anni
1.349
-0.093
-6.42%
1 gen 2010 anni
1.429
+0.08
5.9%
1 gen 2011 anni
1.599
+0.17
11.91%
1 gen 2012 anni
1.735
+0.136
8.53%
1 gen 2013 anni
1.608
-0.127
-7.32%
1 gen 2014 anni
1.61
+0.002
0.1%
1 gen 2015 anni
1.551
-0.059
-3.68%
1 gen 2016 anni
1.524
-0.027
-1.72%
Classificazione dei paesi secondo i statistiche attuali per anni


Commenti: