29
/it/
it
AIzaSyAYiBZKx7MnpbEhh9jyipgxe19OcubqV5w
April 1, 2024
34704
Fragile and conflict affected situations
FCS
false
2
1
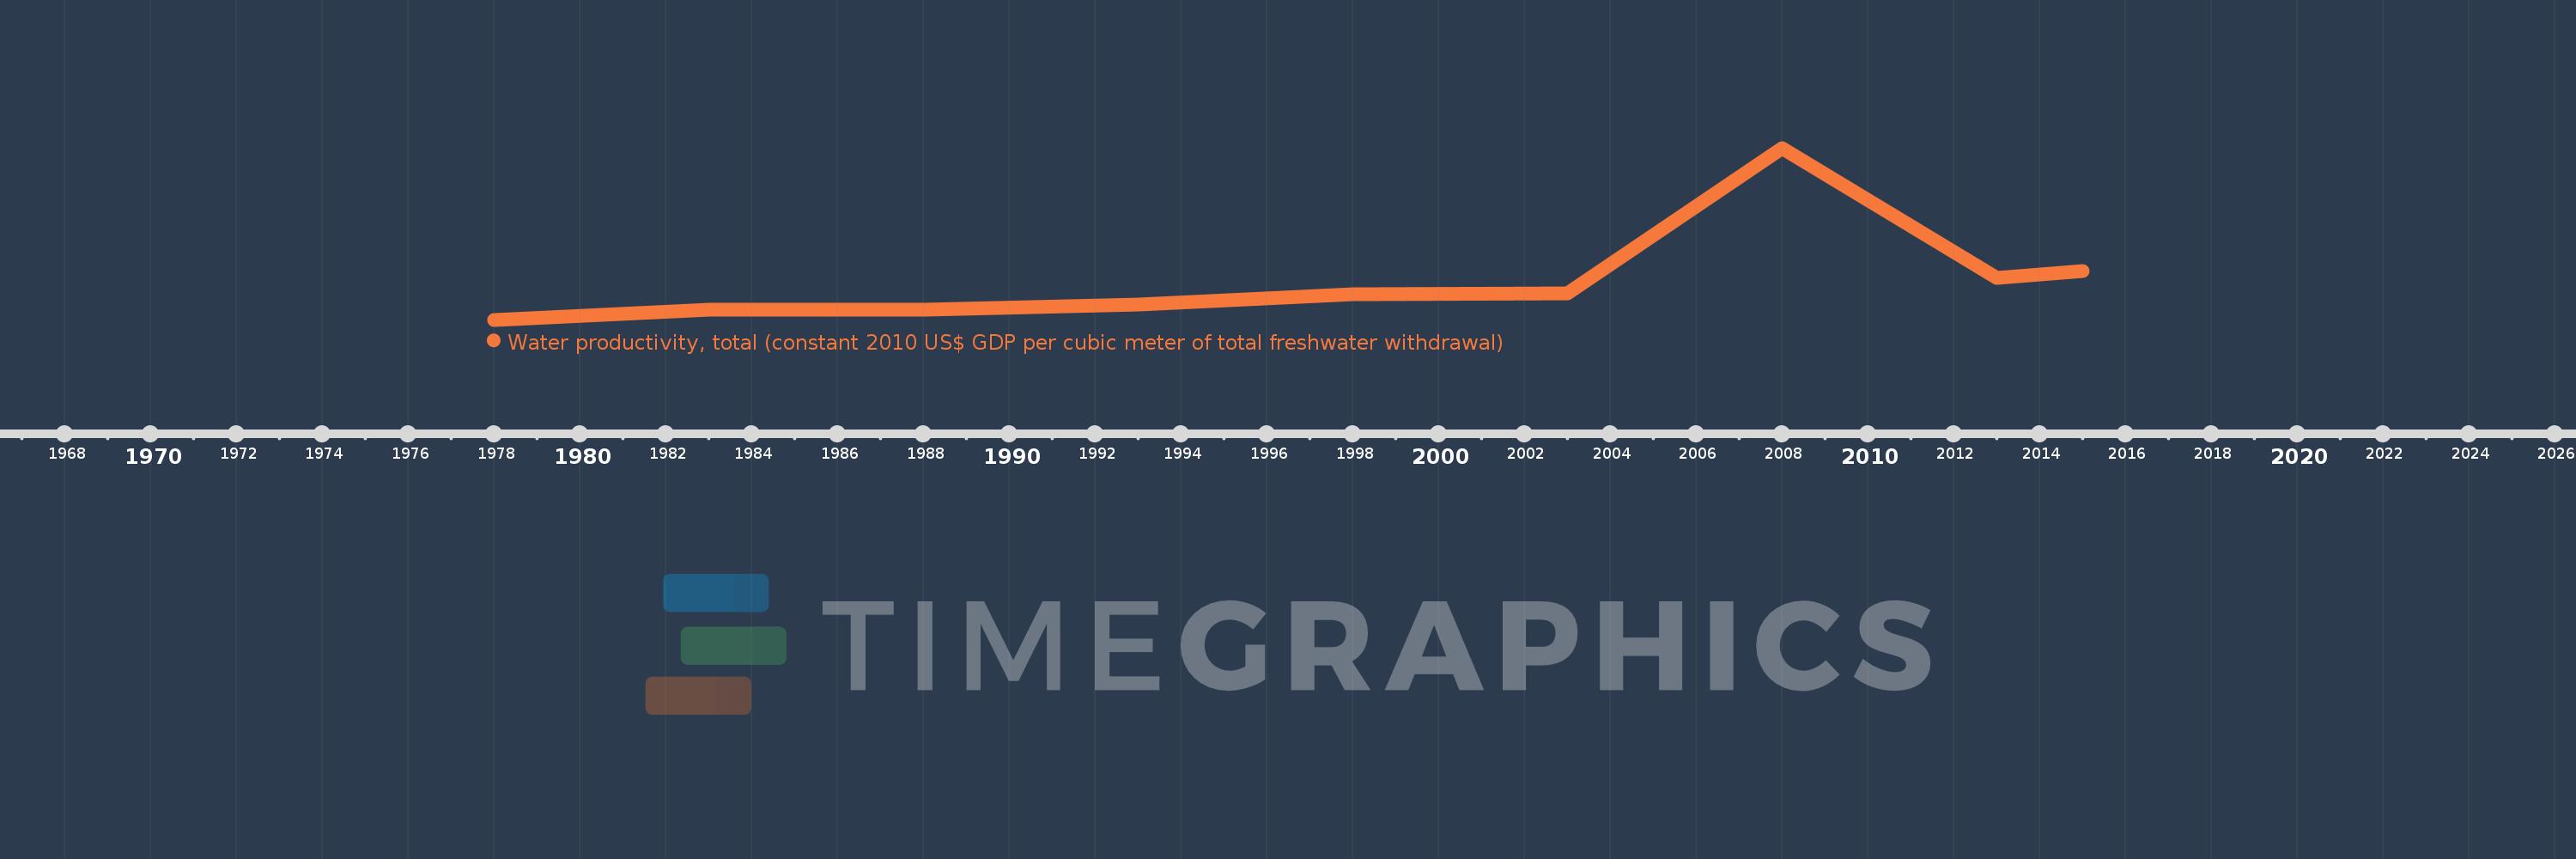
Water productivity, total (constant 2010 US$ GDP per cubic meter of total freshwater withdrawal)
2015,2013,2008,2003,1998,1993,1988,1983,1978
Queste statistiche in altri paesi:
Linea del tempo:
Questa scala temporale mostra un grafico dal 1978 anno al 2015 anno. Fragile and conflict affected situations. I dati fino ad 1977 anno non disponibili. Il numero di osservazioni attuali secondo i date: 9.
La fonte (nome):
Indicatori dello sviluppo mondiale
La fonte (organizzazione):
Food and Agriculture Organization, AQUASTAT data, and World Bank and OECD GDP estimates.
Categorie:
Environment
sono stati aggiornati
23 apr 2017 anni
Indicatori delle variazioni dei valori per anni
Minima:
0.638
1 gen 1978 anni
Massimo:
9.285
1 gen 2008 anni
Alla data di osservazione
Valore
Variazione assoluta
La variazione rispetto al valore precedente
1 gen 1978 anni
0.638
+0.638
0.0%
1 gen 1983 anni
1.157
+0.519
81.39%
1 gen 1988 anni
1.155
-0.003
-0.25%
1 gen 1993 anni
1.406
+0.251
21.73%
1 gen 1998 anni
1.927
+0.521
37.07%
1 gen 2003 anni
1.965
+0.038
1.99%
1 gen 2008 anni
9.285
+7.32
372.52%
1 gen 2013 anni
2.753
-6.531
-70.34%
1 gen 2015 anni
3.102
+0.348
12.65%
Classificazione dei paesi secondo i statistiche attuali per anni


Commenti: