29
/it/
it
AIzaSyAYiBZKx7MnpbEhh9jyipgxe19OcubqV5w
April 1, 2024
34502
Fragile and conflict affected situations
FCS
false
2
1
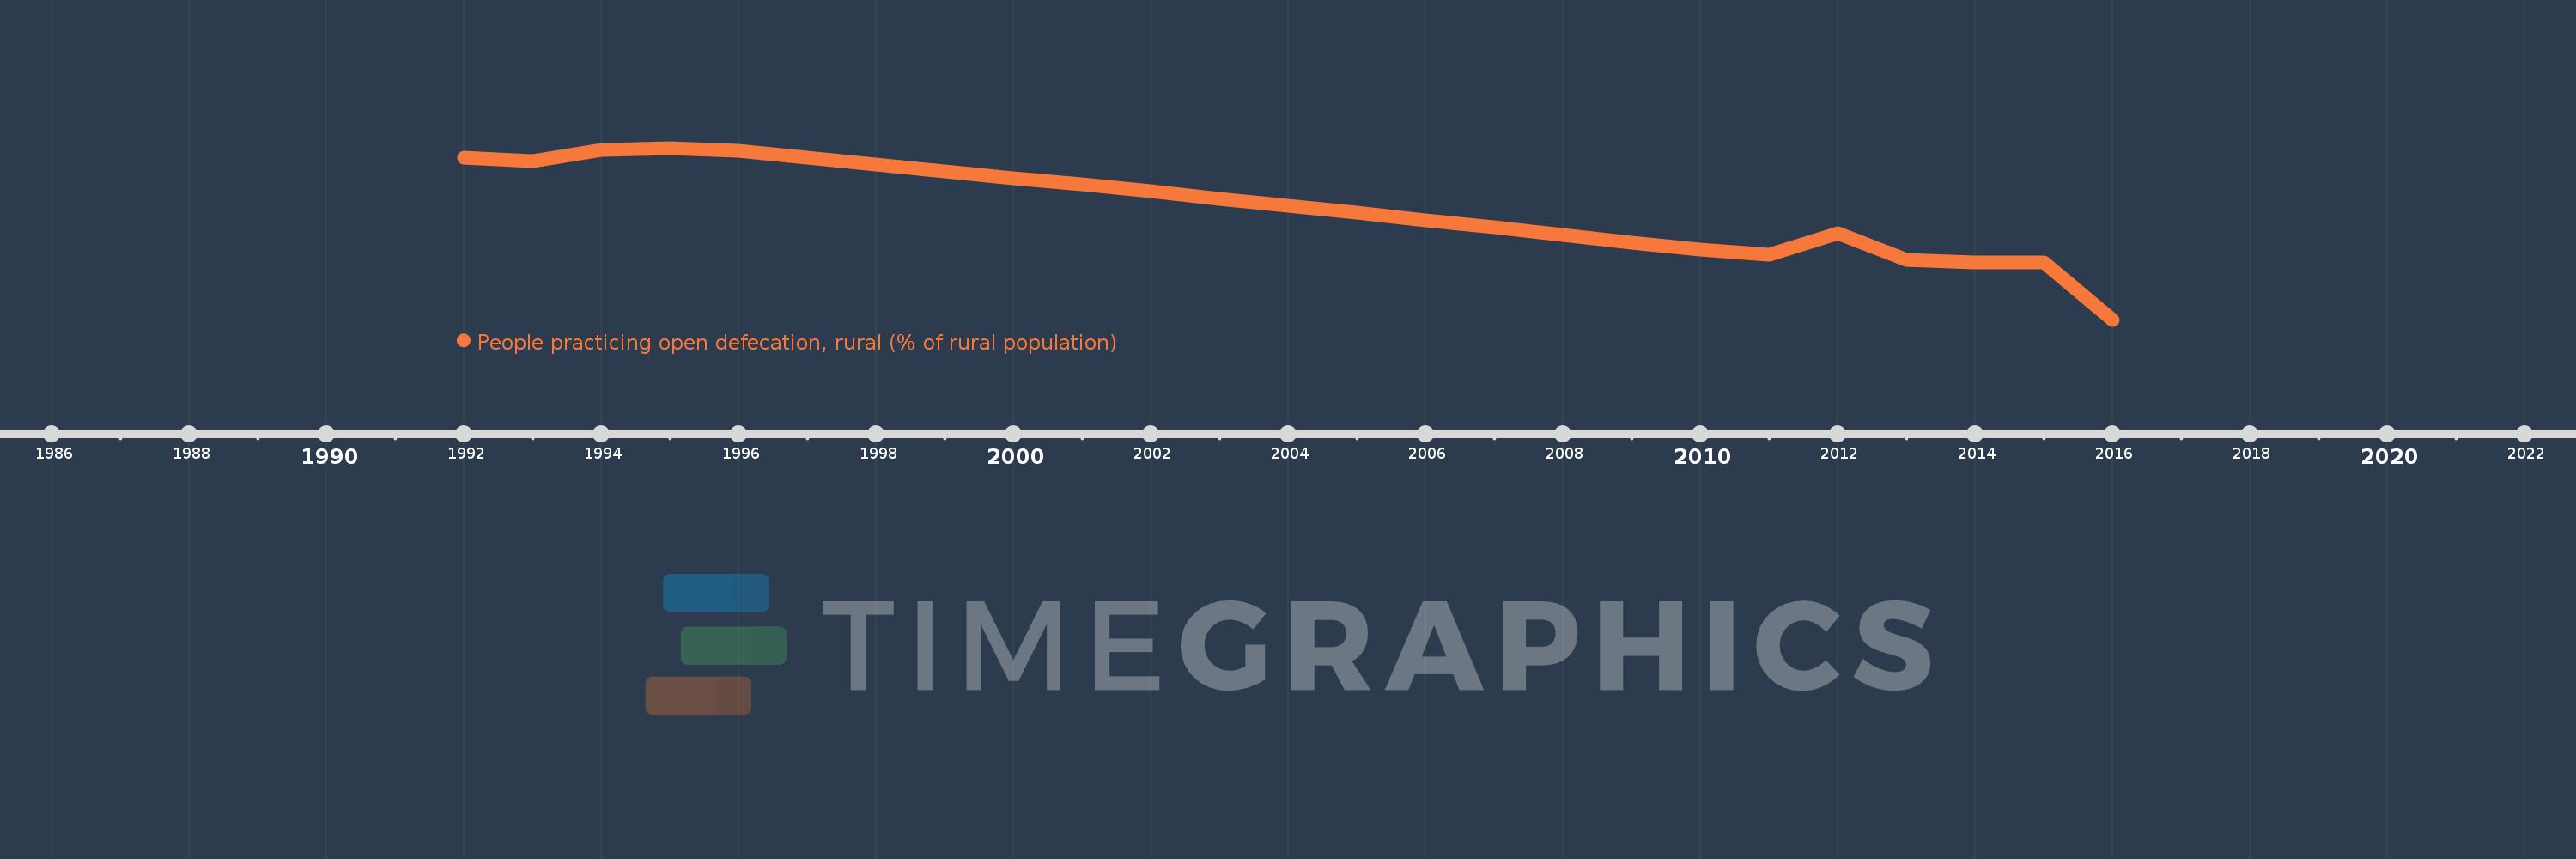
People practicing open defecation, rural (% of rural population)
2016,2015,2014,2013,2012,2011,2010,2009,2008,2007,2006,2005,2004,2003,2002,2001,2000,1999,1998,1997,1996,1995,1994,1993,1992
Queste statistiche in altri paesi:
AfghanistanAlbaniaAlgeriaAmerican SamoaAndorraAngolaAntigua and BarbudaArab WorldArgentinaArmeniaArubaAustraliaAustriaAzerbaijanBahamas, TheBahrainBangladeshBarbadosBelarusBelgiumBelizeBeninBhutanBoliviaBosnia and HerzegovinaBotswanaBrazilBritish Virgin IslandsBulgariaBurkina FasoBurundiCabo VerdeCambodiaCameroonCaribbean small statesCentral African RepublicCentral Europe and the BalticsChadChileChinaColombiaComorosCongo, Dem. Rep.Congo, Rep.Costa RicaCote d'IvoireCroatiaCubaCyprusCzech RepublicDenmarkDjiboutiDominicaDominican RepublicEarly-demographic dividendEast Asia & PacificEast Asia & Pacific (excluding high income)East Asia & Pacific (IDA & IBRD countries)EcuadorEgypt, Arab Rep.El SalvadorEquatorial GuineaEritreaEstoniaEthiopiaEuro areaEurope & Central AsiaEurope & Central Asia (excluding high income)Europe & Central Asia (IDA & IBRD countries)European UnionFijiFinlandFragile and conflict affected situationsFranceFrench PolynesiaGabonGambia, TheGeorgiaGermanyGhanaGreeceGreenlandGrenadaGuamGuatemalaGuineaGuinea-BissauGuyanaHaitiHeavily indebted poor countries (HIPC)High incomeHondurasHungaryIBRD onlyIcelandIDA & IBRD totalIDA blendIDA onlyIDA totalIndiaIndonesiaIran, Islamic Rep.IraqIsraelItalyJamaicaJapanJordanKazakhstanKenyaKiribatiKorea, Dem. People’s Rep.Korea, Rep.KuwaitKyrgyz RepublicLao PDRLate-demographic dividendLatin America & Caribbean Latin America & Caribbean (excluding high income)Latin America & the Caribbean (IDA & IBRD countries)LatviaLeast developed countries: UN classificationLebanonLesothoLiberiaLow & middle incomeLow incomeLower middle incomeLuxembourgMacedonia, FYRMadagascarMalawiMalaysiaMaldivesMaliMaltaMarshall IslandsMauritaniaMauritiusMexicoMicronesia, Fed. Sts.Middle East & North AfricaMiddle East & North Africa (excluding high income)Middle East & North Africa (IDA & IBRD countries)Middle incomeMoldovaMongoliaMontenegroMoroccoMozambiqueMyanmarNamibiaNepalNetherlandsNew CaledoniaNicaraguaNigerNigeriaNorth AmericaNorthern Mariana IslandsNorwayOECD membersOmanOther small statesPacific island small statesPakistanPalauPanamaPapua New GuineaParaguayPeruPhilippinesPolandPortugalPost-demographic dividendPre-demographic dividendPuerto RicoRussian FederationRwandaSamoaSao Tome and PrincipeSaudi ArabiaSenegalSerbiaSeychellesSierra LeoneSlovak RepublicSloveniaSmall statesSolomon IslandsSomaliaSouth AfricaSouth AsiaSouth Asia (IDA & IBRD)South SudanSpainSri LankaSt. Kitts and NevisSt. LuciaSt. Vincent and the GrenadinesSub-Saharan Africa Sub-Saharan Africa (excluding high income)Sub-Saharan Africa (IDA & IBRD countries)SudanSurinameSwazilandSwedenSwitzerlandSyrian Arab RepublicTajikistanTanzaniaThailandTimor-LesteTogoTrinidad and TobagoTunisiaTurkeyTurkmenistanTurks and Caicos IslandsTuvaluUgandaUkraineUnited Arab EmiratesUnited KingdomUnited StatesUpper middle incomeUruguayUzbekistanVanuatuVenezuela, RBVietnamWest Bank and GazaWorldYemen, Rep.ZambiaZimbabwe Linea del tempo:
Questa scala temporale mostra un grafico dal 1992 anno al 2016 anno. Fragile and conflict affected situations. I dati fino ad 1991 anno non disponibili. Il numero di osservazioni attuali secondo i date: 25.
La fonte (nome):
Indicatori dello sviluppo mondiale
La fonte (organizzazione):
WHO/UNICEF Joint Monitoring Programme (JMP) for Water Supply and Sanitation (http://www.wssinfo.org/).
Categorie:
Health
sono stati aggiornati
23 apr 2017 anni
Indicatori delle variazioni dei valori per anni
Minima:
27.068
1 gen 2016 anni
Massimo:
36.928
1 gen 1995 anni
Alla data di osservazione
Valore
Variazione assoluta
La variazione rispetto al valore precedente
1 gen 1992 anni
36.382
+36.382
0.0%
1 gen 1993 anni
36.172
-0.209
-0.58%
1 gen 1994 anni
36.81
+0.637
1.76%
1 gen 1995 anni
36.928
+0.118
0.32%
1 gen 1996 anni
36.746
-0.182
-0.49%
1 gen 1997 anni
36.367
-0.379
-1.03%
1 gen 1998 anni
35.97
-0.397
-1.09%
1 gen 1999 anni
35.561
-0.409
-1.14%
1 gen 2000 anni
35.177
-0.384
-1.08%
1 gen 2001 anni
34.839
-0.337
-0.96%
1 gen 2002 anni
34.432
-0.407
-1.17%
1 gen 2003 anni
34.024
-0.408
-1.19%
1 gen 2004 anni
33.6
-0.424
-1.25%
1 gen 2005 anni
33.192
-0.408
-1.22%
1 gen 2006 anni
32.774
-0.418
-1.26%
1 gen 2007 anni
32.354
-0.421
-1.28%
1 gen 2008 anni
31.935
-0.419
-1.29%
1 gen 2009 anni
31.48
-0.455
-1.42%
1 gen 2010 anni
31.117
-0.363
-1.15%
1 gen 2011 anni
30.799
-0.319
-1.02%
1 gen 2012 anni
32.025
+1.226
3.98%
1 gen 2013 anni
30.527
-1.498
-4.68%
1 gen 2014 anni
30.335
-0.192
-0.63%
1 gen 2015 anni
30.344
+0.009
0.03%
1 gen 2016 anni
27.068
-3.276
-10.8%
Classificazione dei paesi secondo i statistiche attuali per anni


Commenti: