29
/it/
it
AIzaSyAYiBZKx7MnpbEhh9jyipgxe19OcubqV5w
April 1, 2024
33578
European Union
EUU
false
2
1
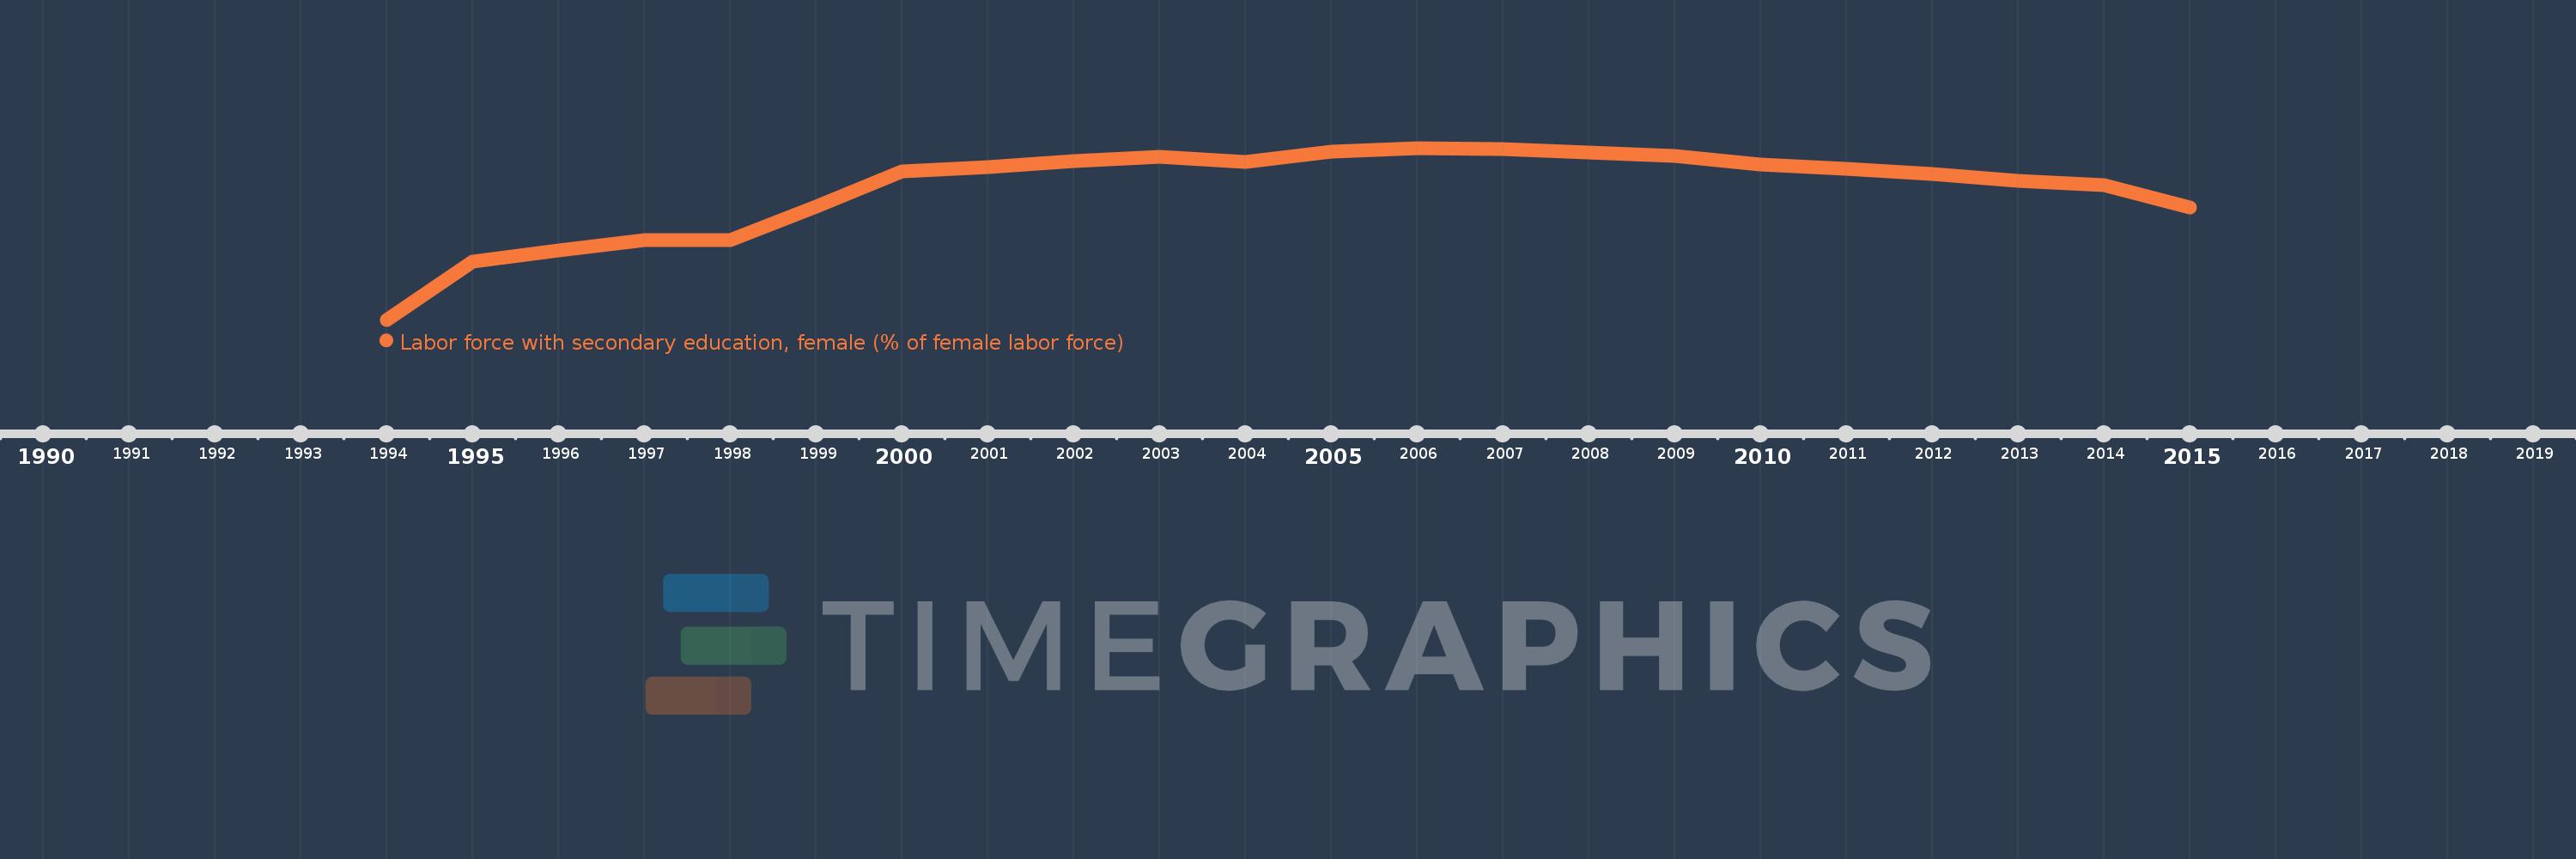
Labor force with secondary education, female (% of female labor force)
2015,2014,2013,2012,2011,2010,2009,2008,2007,2006,2005,2004,2003,2002,2001,2000,1999,1998,1997,1996,1995,1994
Queste statistiche in altri paesi:
Linea del tempo:
Questa scala temporale mostra un grafico dal 1994 anno al 2015 anno. European Union. I dati fino ad 1993 anno non disponibili. Il numero di osservazioni attuali secondo i date: 22.
La fonte (nome):
Indicatori dello sviluppo mondiale
La fonte (organizzazione):
International Labour Organization, Key Indicators of the Labour Market database.
Categorie:
Education, Social Protection & Labor, Gender
sono stati aggiornati
23 apr 2017 anni
Indicatori delle variazioni dei valori per anni
Minima:
38.796
1 gen 1994 anni
Massimo:
50.967
1 gen 2006 anni
Alla data di osservazione
Valore
Variazione assoluta
La variazione rispetto al valore precedente
1 gen 1994 anni
38.796
+38.796
0.0%
1 gen 1995 anni
42.9
+4.104
10.58%
1 gen 1996 anni
43.731
+0.831
1.94%
1 gen 1997 anni
44.449
+0.718
1.64%
1 gen 1998 anni
44.429
-0.02
-0.04%
1 gen 1999 anni
46.797
+2.367
5.33%
1 gen 2000 anni
49.284
+2.488
5.32%
1 gen 2001 anni
49.635
+0.35
0.71%
1 gen 2002 anni
50.051
+0.416
0.84%
1 gen 2003 anni
50.323
+0.273
0.54%
1 gen 2004 anni
49.965
-0.358
-0.71%
1 gen 2005 anni
50.731
+0.765
1.53%
1 gen 2006 anni
50.967
+0.236
0.47%
1 gen 2007 anni
50.897
-0.07
-0.14%
1 gen 2008 anni
50.64
-0.257
-0.51%
1 gen 2009 anni
50.401
-0.238
-0.47%
1 gen 2010 anni
49.783
-0.618
-1.23%
1 gen 2011 anni
49.479
-0.304
-0.61%
1 gen 2012 anni
49.101
-0.379
-0.77%
1 gen 2013 anni
48.649
-0.452
-0.92%
1 gen 2014 anni
48.359
-0.29
-0.6%
1 gen 2015 anni
46.765
-1.594
-3.3%
Classificazione dei paesi secondo i statistiche attuali per anni


Commenti: