29
/it/
it
AIzaSyAYiBZKx7MnpbEhh9jyipgxe19OcubqV5w
April 1, 2024
33471
European Union
EUU
false
2
1
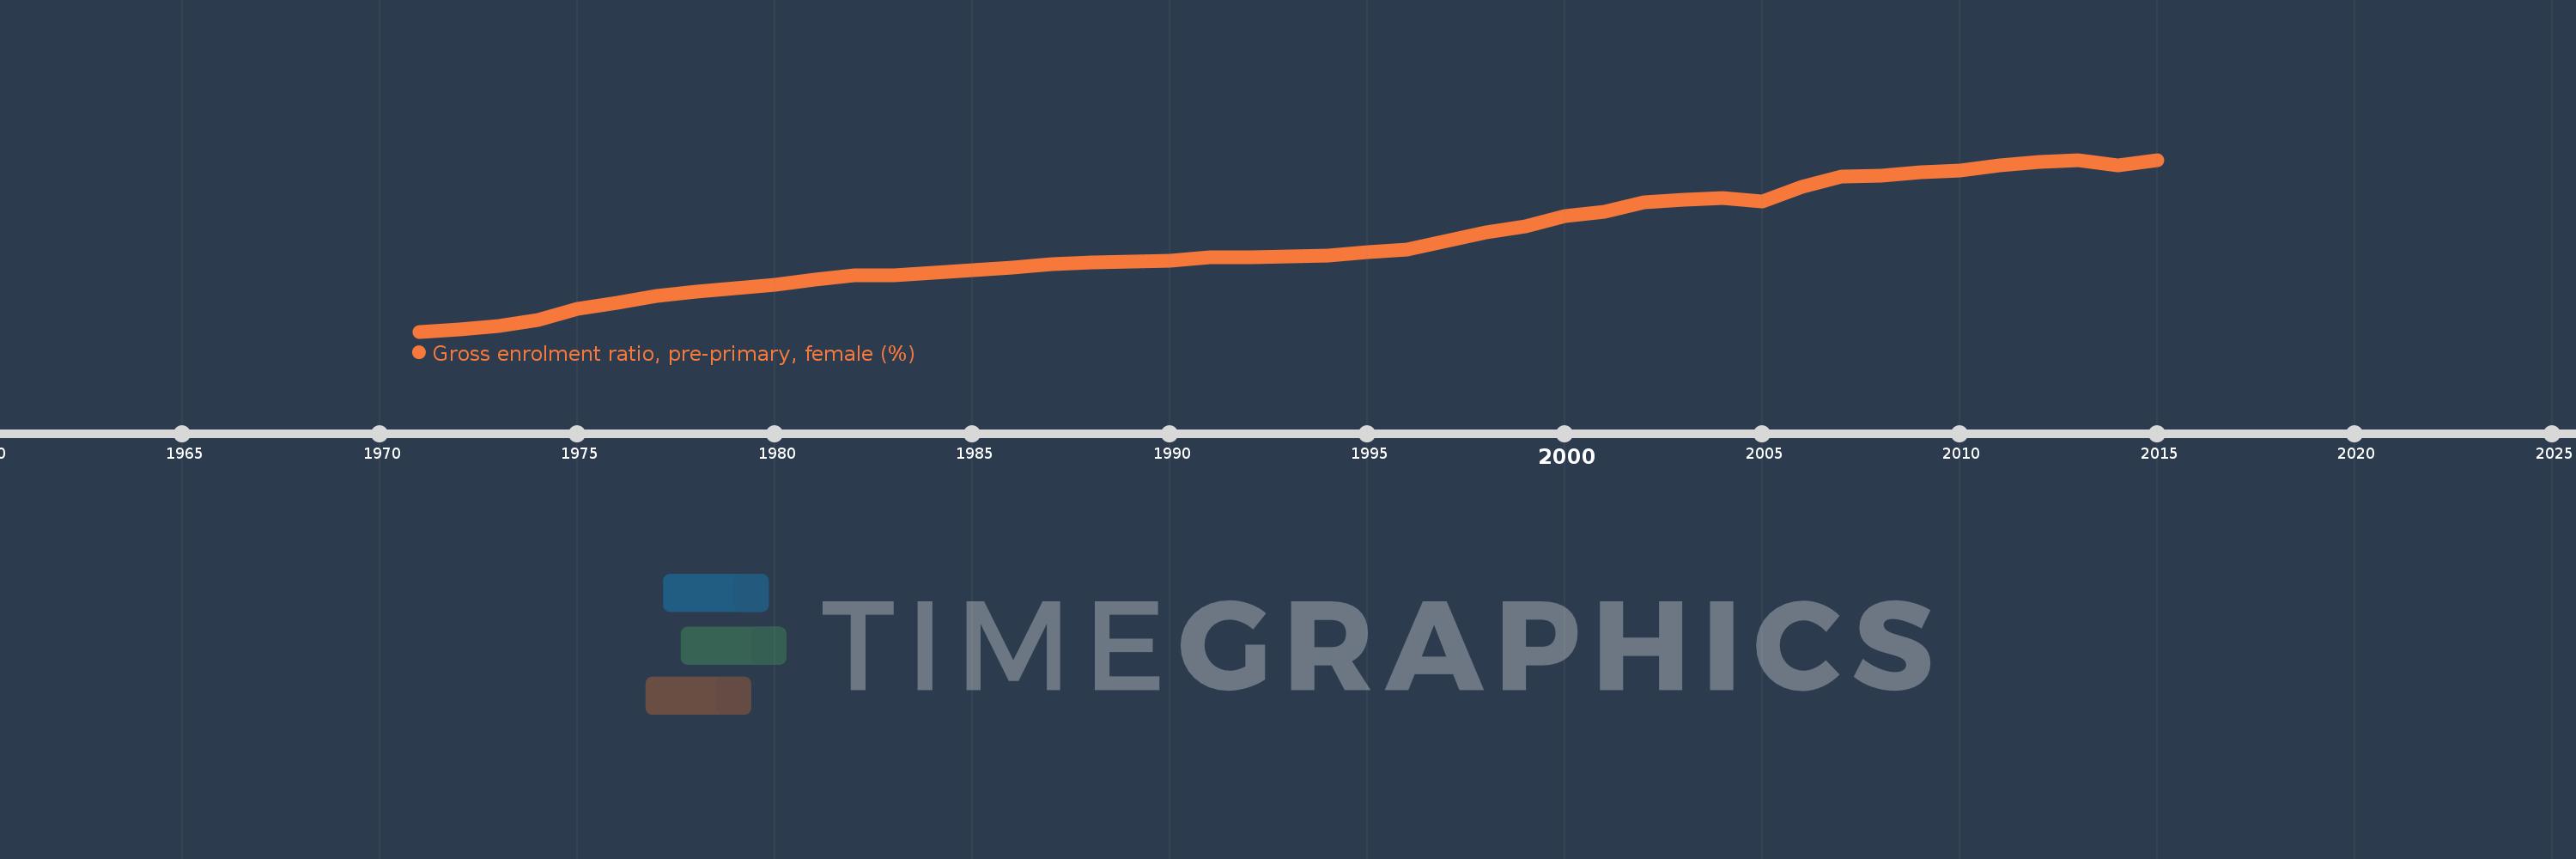
Gross enrolment ratio, pre-primary, female (%)
2015,2014,2013,2012,2011,2010,2009,2008,2007,2006,2005,2004,2003,2002,2001,2000,1999,1998,1997,1996,1995,1994,1993,1992,1991,1990,1989,1988,1987,1986,1985,1984,1983,1982,1981,1980,1979,1978,1977,1976,1975,1974,1973,1972,1971
Queste statistiche in altri paesi:
AfghanistanAlbaniaAlgeriaAndorraAngolaAntigua and BarbudaArab WorldArgentinaArmeniaArubaAustraliaAustriaAzerbaijanBahamas, TheBahrainBangladeshBarbadosBelarusBelgiumBelizeBeninBermudaBhutanBoliviaBosnia and HerzegovinaBotswanaBrazilBrunei DarussalamBulgariaBurkina FasoBurundiCabo VerdeCambodiaCameroonCanadaCaribbean small statesCentral African RepublicCentral Europe and the BalticsChadChileChinaColombiaComorosCongo, Dem. Rep.Congo, Rep.Costa RicaCote d'IvoireCroatiaCubaCyprusCzech RepublicDenmarkDjiboutiDominicaDominican RepublicEarly-demographic dividendEast Asia & PacificEast Asia & Pacific (excluding high income)East Asia & Pacific (IDA & IBRD countries)EcuadorEgypt, Arab Rep.El SalvadorEquatorial GuineaEritreaEstoniaEthiopiaEuro areaEurope & Central AsiaEurope & Central Asia (excluding high income)Europe & Central Asia (IDA & IBRD countries)European UnionFijiFinlandFragile and conflict affected situationsFranceGabonGambia, TheGeorgiaGermanyGhanaGreeceGrenadaGuatemalaGuineaGuinea-BissauGuyanaHeavily indebted poor countries (HIPC)High incomeHondurasHong Kong SAR, ChinaHungaryIBRD onlyIcelandIDA & IBRD totalIDA blendIDA onlyIDA totalIndiaIndonesiaIran, Islamic Rep.IraqIrelandIsraelItalyJamaicaJapanJordanKazakhstanKenyaKorea, Dem. People’s Rep.Korea, Rep.KuwaitKyrgyz RepublicLao PDRLate-demographic dividendLatin America & Caribbean Latin America & Caribbean (excluding high income)Latin America & the Caribbean (IDA & IBRD countries)LatviaLeast developed countries: UN classificationLebanonLesothoLiberiaLibyaLiechtensteinLithuaniaLow & middle incomeLow incomeLower middle incomeLuxembourgMacao SAR, ChinaMacedonia, FYRMadagascarMaldivesMaliMaltaMarshall IslandsMauritaniaMauritiusMexicoMicronesia, Fed. Sts.Middle East & North AfricaMiddle East & North Africa (excluding high income)Middle East & North Africa (IDA & IBRD countries)Middle incomeMoldovaMongoliaMontenegroMoroccoMozambiqueMyanmarNamibiaNauruNepalNetherlandsNew ZealandNicaraguaNigerNigeriaNorth AmericaNorwayOECD membersOmanOther small statesPacific island small statesPakistanPalauPanamaPapua New GuineaParaguayPeruPhilippinesPolandPortugalPost-demographic dividendPre-demographic dividendPuerto RicoQatarRomaniaRussian FederationRwandaSamoaSan MarinoSao Tome and PrincipeSaudi ArabiaSenegalSerbiaSeychellesSierra LeoneSlovak RepublicSloveniaSmall statesSolomon IslandsSomaliaSouth AfricaSouth AsiaSouth Asia (IDA & IBRD)South SudanSpainSri LankaSt. Kitts and NevisSt. LuciaSt. Vincent and the GrenadinesSub-Saharan Africa Sub-Saharan Africa (excluding high income)Sub-Saharan Africa (IDA & IBRD countries)SudanSurinameSwazilandSwedenSwitzerlandSyrian Arab RepublicTajikistanTanzaniaThailandTimor-LesteTogoTongaTrinidad and TobagoTunisiaTurkeyTurkmenistanTuvaluUgandaUkraineUnited Arab EmiratesUnited KingdomUnited StatesUpper middle incomeUruguayUzbekistanVanuatuVenezuela, RBVietnamWest Bank and GazaWorldYemen, Rep.Zimbabwe Linea del tempo:
Questa scala temporale mostra un grafico dal 1971 anno al 2015 anno. European Union. I dati fino ad 1970 anno non disponibili. Il numero di osservazioni attuali secondo i date: 45.
La fonte (nome):
Indicatori dello sviluppo mondiale
La fonte (organizzazione):
UNESCO Institute for Statistics
Categorie:
Education, Gender
sono stati aggiornati
23 apr 2017 anni
Indicatori delle variazioni dei valori per anni
Minima:
58.629
1 gen 1971 anni
Massimo:
96.214
1 gen 2015 anni
Alla data di osservazione
Valore
Variazione assoluta
La variazione rispetto al valore precedente
1 gen 1971 anni
58.629
+58.629
0.0%
1 gen 1972 anni
59.079
+0.45
0.77%
1 gen 1973 anni
59.764
+0.685
1.16%
1 gen 1974 anni
61.247
+1.483
2.48%
1 gen 1975 anni
63.668
+2.421
3.95%
1 gen 1976 anni
64.831
+1.163
1.83%
1 gen 1977 anni
66.4
+1.57
2.42%
1 gen 1978 anni
67.358
+0.958
1.44%
1 gen 1979 anni
68.105
+0.747
1.11%
1 gen 1980 anni
68.882
+0.777
1.14%
1 gen 1981 anni
70.048
+1.166
1.69%
1 gen 1982 anni
70.877
+0.829
1.18%
1 gen 1983 anni
71.028
+0.151
0.21%
1 gen 1984 anni
71.422
+0.394
0.55%
1 gen 1985 anni
72.066
+0.644
0.9%
1 gen 1986 anni
72.577
+0.511
0.71%
1 gen 1987 anni
73.353
+0.776
1.07%
1 gen 1988 anni
73.72
+0.367
0.5%
1 gen 1989 anni
73.865
+0.145
0.2%
1 gen 1990 anni
74.152
+0.287
0.39%
1 gen 1991 anni
74.956
+0.804
1.08%
1 gen 1992 anni
74.96
+0.004
0.01%
1 gen 1993 anni
74.992
+0.032
0.04%
1 gen 1994 anni
75.344
+0.352
0.47%
1 gen 1995 anni
76.075
+0.731
0.97%
1 gen 1996 anni
76.494
+0.419
0.55%
1 gen 1997 anni
78.503
+2.009
2.63%
1 gen 1998 anni
80.35
+1.847
2.35%
1 gen 1999 anni
81.659
+1.309
1.63%
1 gen 2000 anni
83.822
+2.163
2.65%
1 gen 2001 anni
84.839
+1.016
1.21%
1 gen 2002 anni
86.835
+1.997
2.35%
1 gen 2003 anni
87.535
+0.699
0.81%
1 gen 2004 anni
87.924
+0.39
0.45%
1 gen 2005 anni
87.083
-0.841
-0.96%
1 gen 2006 anni
90.251
+3.168
3.64%
1 gen 2007 anni
92.551
+2.3
2.55%
1 gen 2008 anni
92.796
+0.245
0.26%
1 gen 2009 anni
93.537
+0.742
0.8%
1 gen 2010 anni
93.884
+0.347
0.37%
1 gen 2011 anni
94.909
+1.025
1.09%
1 gen 2012 anni
95.766
+0.857
0.9%
1 gen 2013 anni
96.027
+0.261
0.27%
1 gen 2014 anni
94.991
-1.036
-1.08%
1 gen 2015 anni
96.214
+1.223
1.29%
Classificazione dei paesi secondo i statistiche attuali per anni


Commenti: