29
/it/
it
AIzaSyAYiBZKx7MnpbEhh9jyipgxe19OcubqV5w
April 1, 2024
33232
European Union
EUU
false
2
1
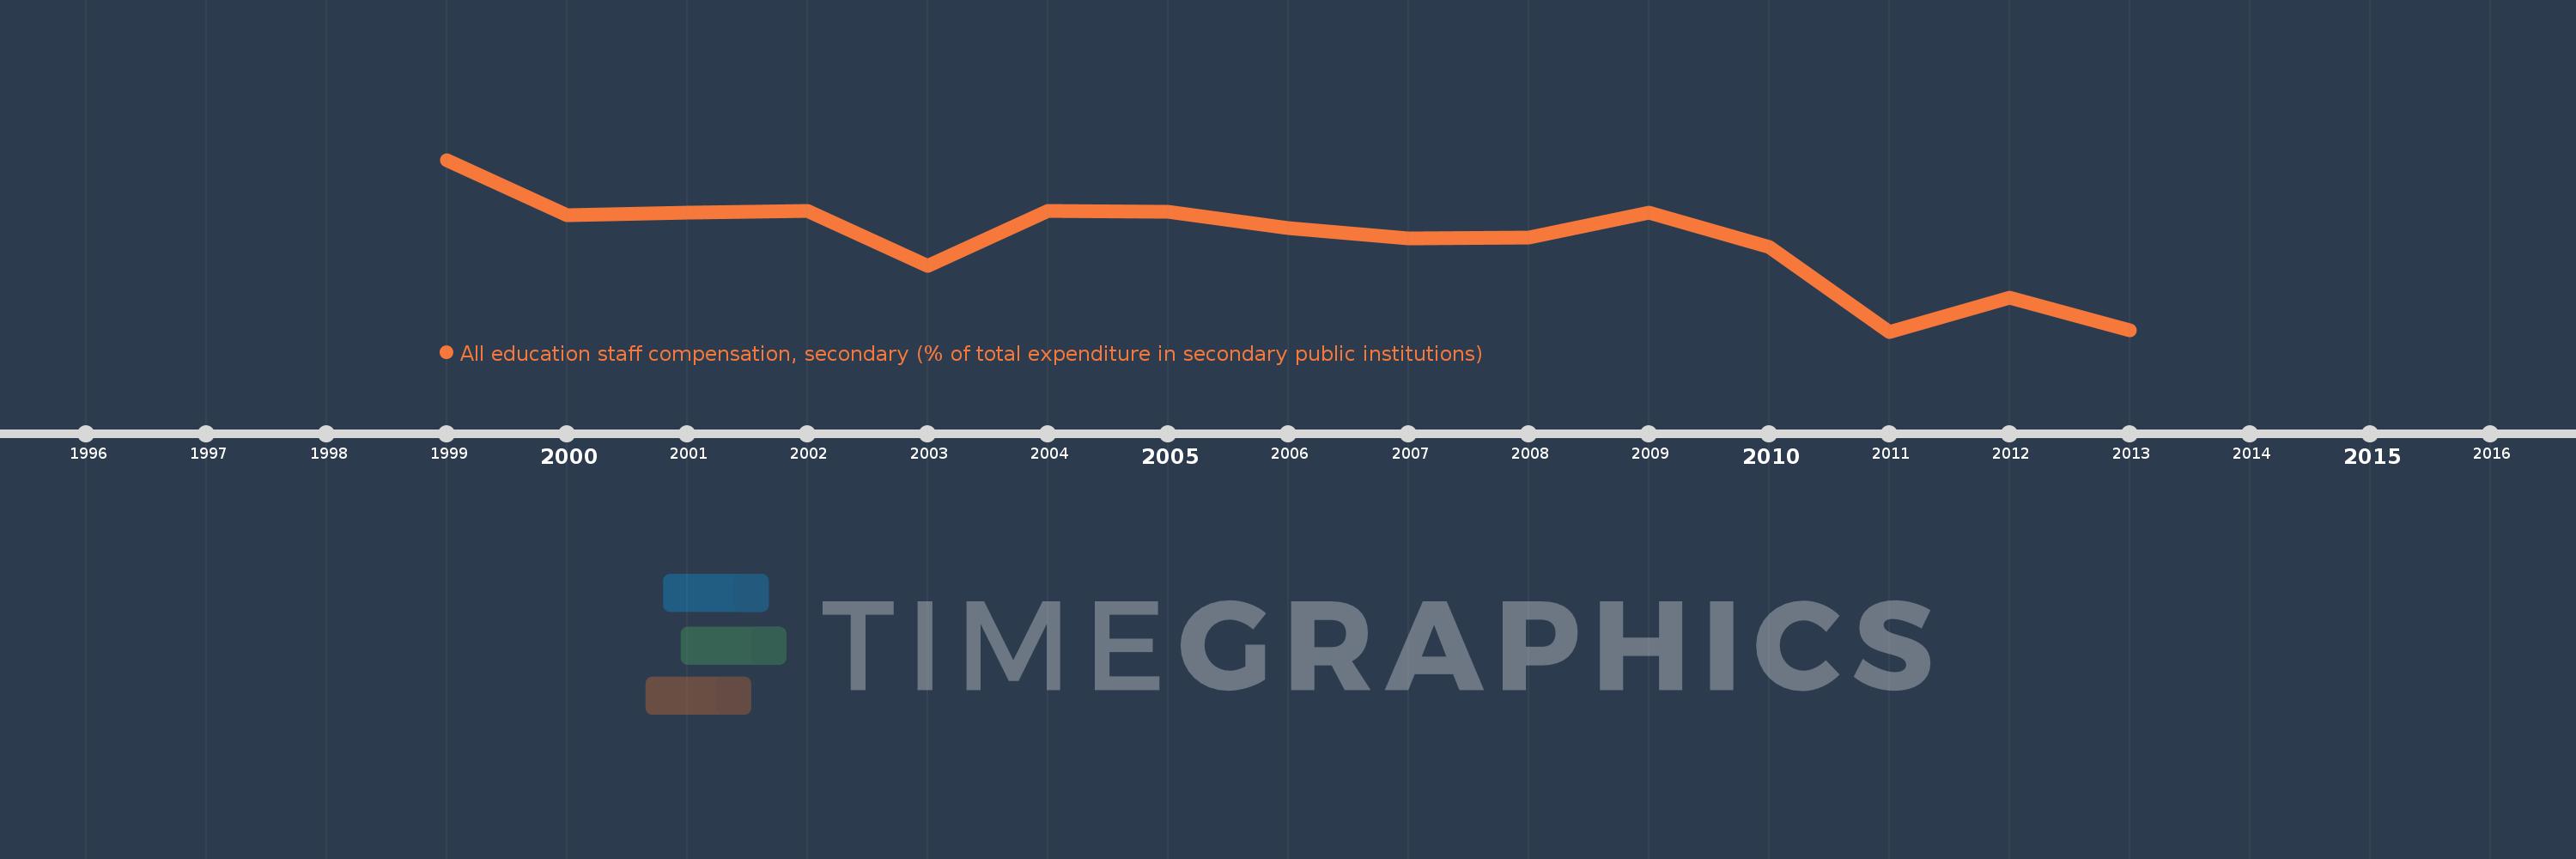
All education staff compensation, secondary (% of total expenditure in secondary public institutions)
2013,2012,2011,2010,2009,2008,2007,2006,2005,2004,2003,2002,2001,2000,1999
Queste statistiche in altri paesi:
Linea del tempo:
Questa scala temporale mostra un grafico dal 1999 anno al 2013 anno. European Union. I dati fino ad 1998 anno non disponibili. Il numero di osservazioni attuali secondo i date: 15.
La fonte (nome):
Indicatori dello sviluppo mondiale
La fonte (organizzazione):
United Nations Educational, Scientific, and Cultural Organization (UNESCO) Institute for Statistics.
Categorie:
Education
sono stati aggiornati
23 apr 2017 anni
Indicatori delle variazioni dei valori per anni
Minima:
71.221
1 gen 2011 anni
Massimo:
75.217
1 gen 1999 anni
Alla data di osservazione
Valore
Variazione assoluta
La variazione rispetto al valore precedente
1 gen 1999 anni
75.217
+75.217
0.0%
1 gen 2000 anni
73.938
-1.279
-1.7%
1 gen 2001 anni
73.988
+0.05
0.07%
1 gen 2002 anni
74.034
+0.046
0.06%
1 gen 2003 anni
72.744
-1.29
-1.74%
1 gen 2004 anni
74.035
+1.291
1.77%
1 gen 2005 anni
73.999
-0.036
-0.05%
1 gen 2006 anni
73.621
-0.378
-0.51%
1 gen 2007 anni
73.382
-0.239
-0.32%
1 gen 2008 anni
73.408
+0.026
0.04%
1 gen 2009 anni
73.984
+0.576
0.78%
1 gen 2010 anni
73.198
-0.786
-1.06%
1 gen 2011 anni
71.221
-1.977
-2.7%
1 gen 2012 anni
72.009
+0.788
1.11%
1 gen 2013 anni
71.247
-0.762
-1.06%
Classificazione dei paesi secondo i statistiche attuali per anni


Commenti: