29
/it/
it
AIzaSyAYiBZKx7MnpbEhh9jyipgxe19OcubqV5w
April 1, 2024
32909
Europe & Central Asia (IDA & IBRD countries)
TEC
false
2
1
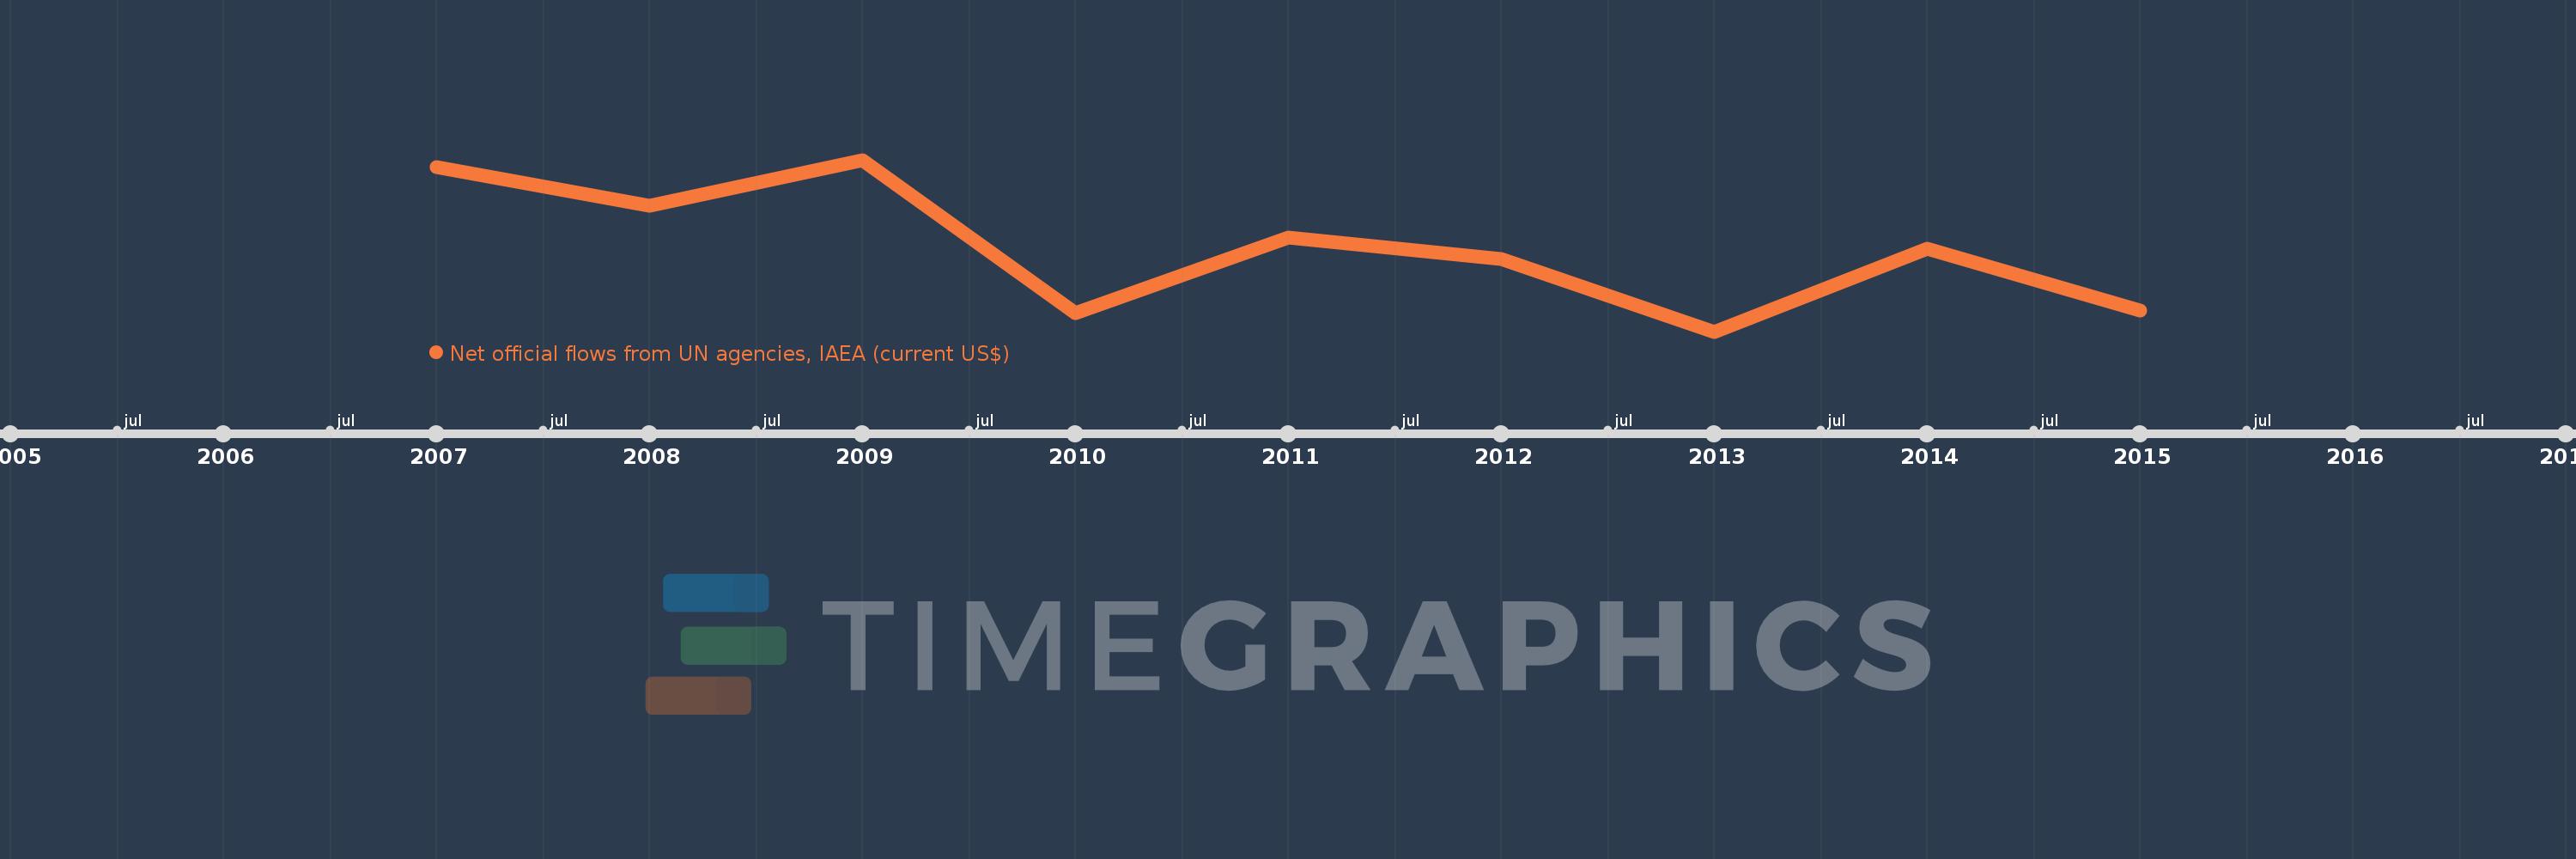
Net official flows from UN agencies, IAEA (current US$)
2015,2014,2013,2012,2011,2010,2009,2008,2007
Queste statistiche in altri paesi:
Linea del tempo:
Questa scala temporale mostra un grafico dal 2007 anno al 2015 anno. Europe & Central Asia (IDA & IBRD countries). I dati fino ad 2006 anno non disponibili. Il numero di osservazioni attuali secondo i date: 9.
La fonte (nome):
Indicatori dello sviluppo mondiale
La fonte (organizzazione):
Development Assistance Committee of the Organisation for Economic Co-operation and Development, Geographical Distribution of Financial Flows to Developing Countries, Development Co-operation Report, and International Development Statistics database. Data are available online at: www.oecd.org/dac/stats/idsonline.
Categorie:
Aid Effectiveness
sono stati aggiornati
23 apr 2017 anni
Indicatori delle variazioni dei valori per anni
Minima:
6.35 Mln
1 gen 2013 anni
Massimo:
10.84 Mln
1 gen 2009 anni
Alla data di osservazione
Valore
Variazione assoluta
La variazione rispetto al valore precedente
1 gen 2007 anni
10.65 Mln
+10.65 Mln
0.0%
1 gen 2008 anni
9.63 Mln
-1.02 Mln
-9.58%
1 gen 2009 anni
10.84 Mln
+1.21 Mln
12.56%
1 gen 2010 anni
6.83 Mln
-4.01 Mln
-36.99%
1 gen 2011 anni
8.8 Mln
+1.97 Mln
28.84%
1 gen 2012 anni
8.24 Mln
-560.0 Mille.
-6.36%
1 gen 2013 anni
6.35 Mln
-1.89 Mln
-22.94%
1 gen 2014 anni
8.52 Mln
+2.17 Mln
34.17%
1 gen 2015 anni
6.91 Mln
-1.61 Mln
-18.9%
Classificazione dei paesi secondo i statistiche attuali per anni


Commenti: