29
/it/
it
AIzaSyAYiBZKx7MnpbEhh9jyipgxe19OcubqV5w
April 1, 2024
31870
Europe & Central Asia (excluding high income)
ECA
false
2
1
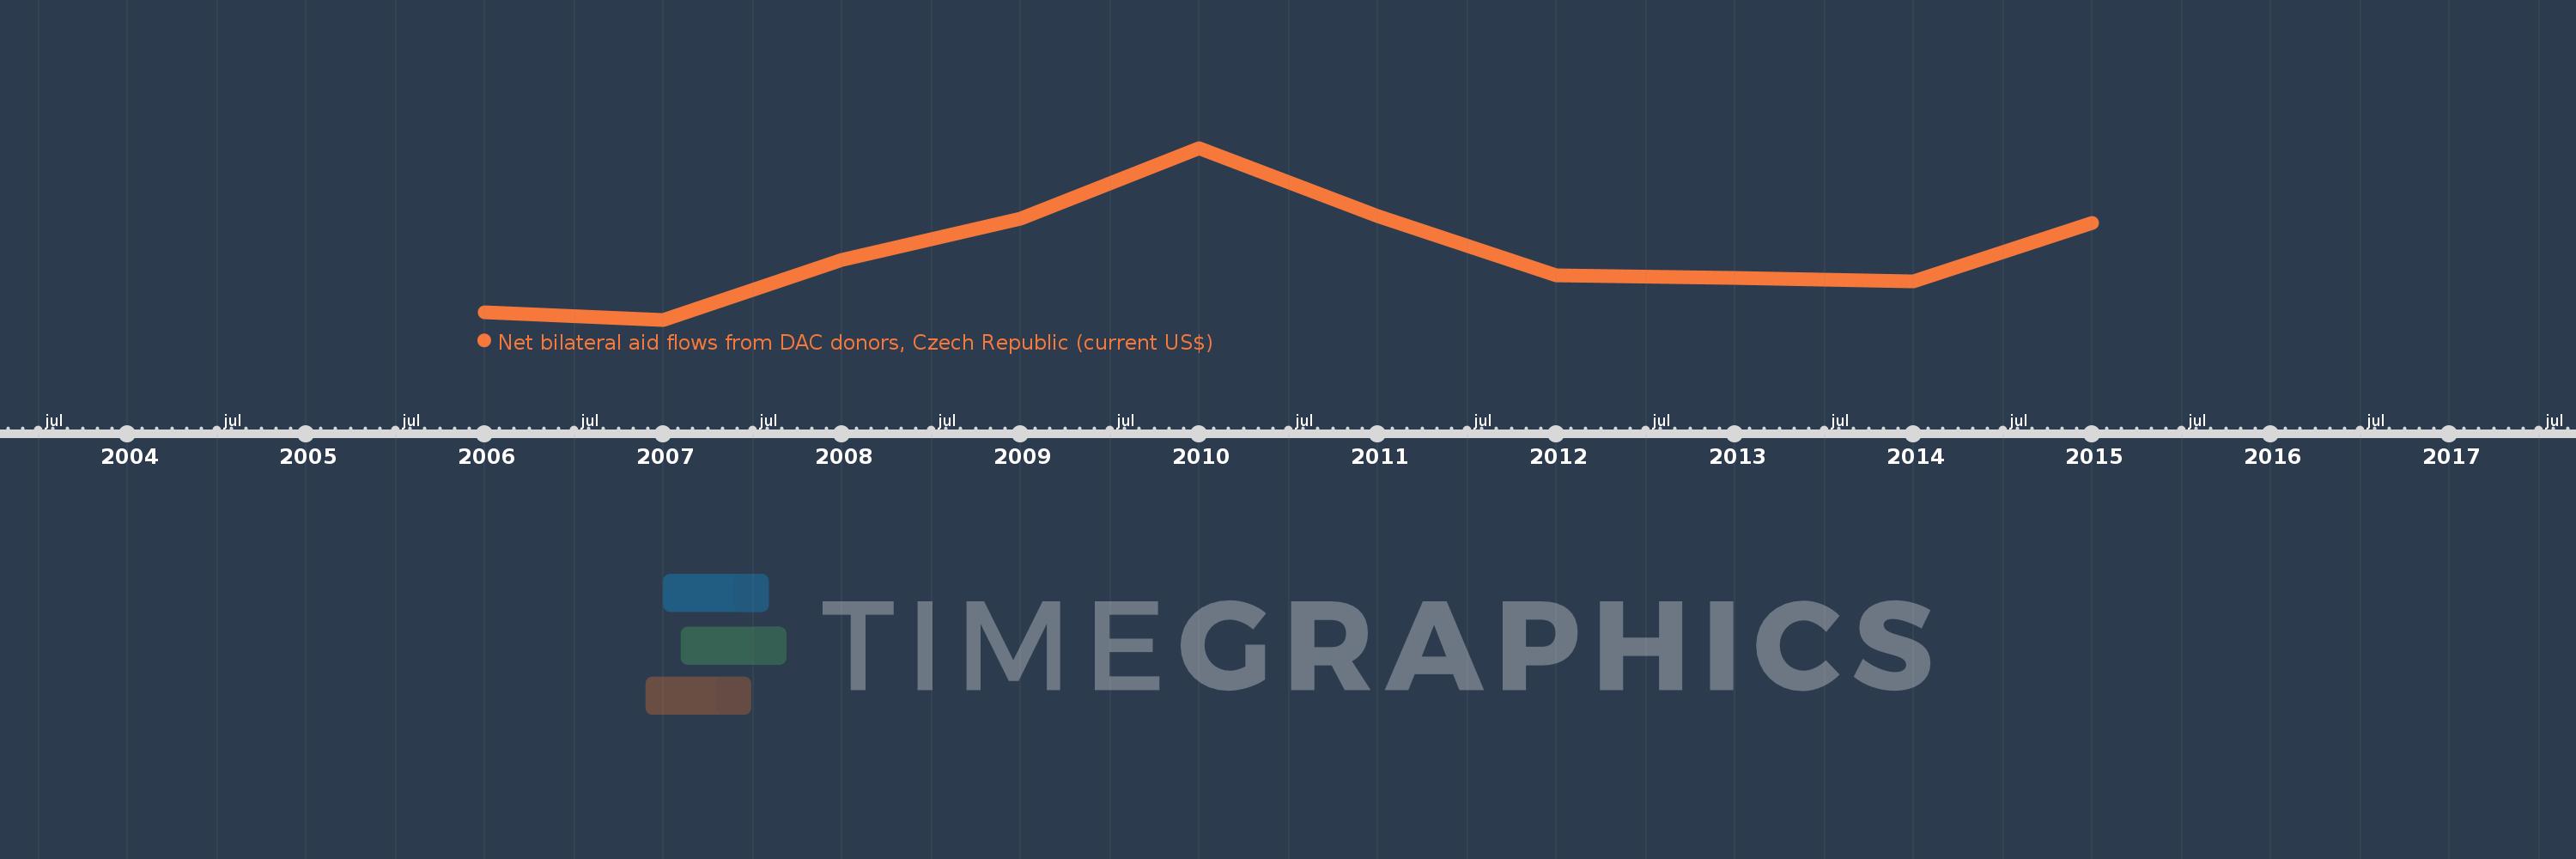
Net bilateral aid flows from DAC donors, Czech Republic (current US$)
2015,2014,2013,2012,2011,2010,2009,2008,2007,2006
Queste statistiche in altri paesi:
Linea del tempo:
Questa scala temporale mostra un grafico dal 2006 anno al 2015 anno. Europe & Central Asia (excluding high income). I dati fino ad 2005 anno non disponibili. Il numero di osservazioni attuali secondo i date: 10.
La fonte (nome):
Indicatori dello sviluppo mondiale
La fonte (organizzazione):
Development Assistance Committee of the Organisation for Economic Co-operation and Development, Geographical Distribution of Financial Flows to Developing Countries, Development Co-operation
Categorie:
Aid Effectiveness
sono stati aggiornati
23 apr 2017 anni
Indicatori delle variazioni dei valori per anni
Minima:
18.05 Mln
1 gen 2007 anni
Massimo:
33.87 Mln
1 gen 2010 anni
Alla data di osservazione
Valore
Variazione assoluta
La variazione rispetto al valore precedente
1 gen 2006 anni
18.75 Mln
+18.75 Mln
0.0%
1 gen 2007 anni
18.05 Mln
-700.0 Mille.
-3.73%
1 gen 2008 anni
23.55 Mln
+5.5 Mln
30.47%
1 gen 2009 anni
27.37 Mln
+3.82 Mln
16.22%
1 gen 2010 anni
33.87 Mln
+6.5 Mln
23.75%
1 gen 2011 anni
27.63 Mln
-6.24 Mln
-18.42%
1 gen 2012 anni
22.17 Mln
-5.46 Mln
-19.76%
1 gen 2013 anni
21.9 Mln
-270.0 Mille.
-1.22%
1 gen 2014 anni
21.59 Mln
-310.0 Mille.
-1.42%
1 gen 2015 anni
26.99 Mln
+5.4 Mln
25.01%
Classificazione dei paesi secondo i statistiche attuali per anni


Commenti: