29
/it/
it
AIzaSyAYiBZKx7MnpbEhh9jyipgxe19OcubqV5w
April 1, 2024
31743
Europe & Central Asia (excluding high income)
ECA
false
2
1
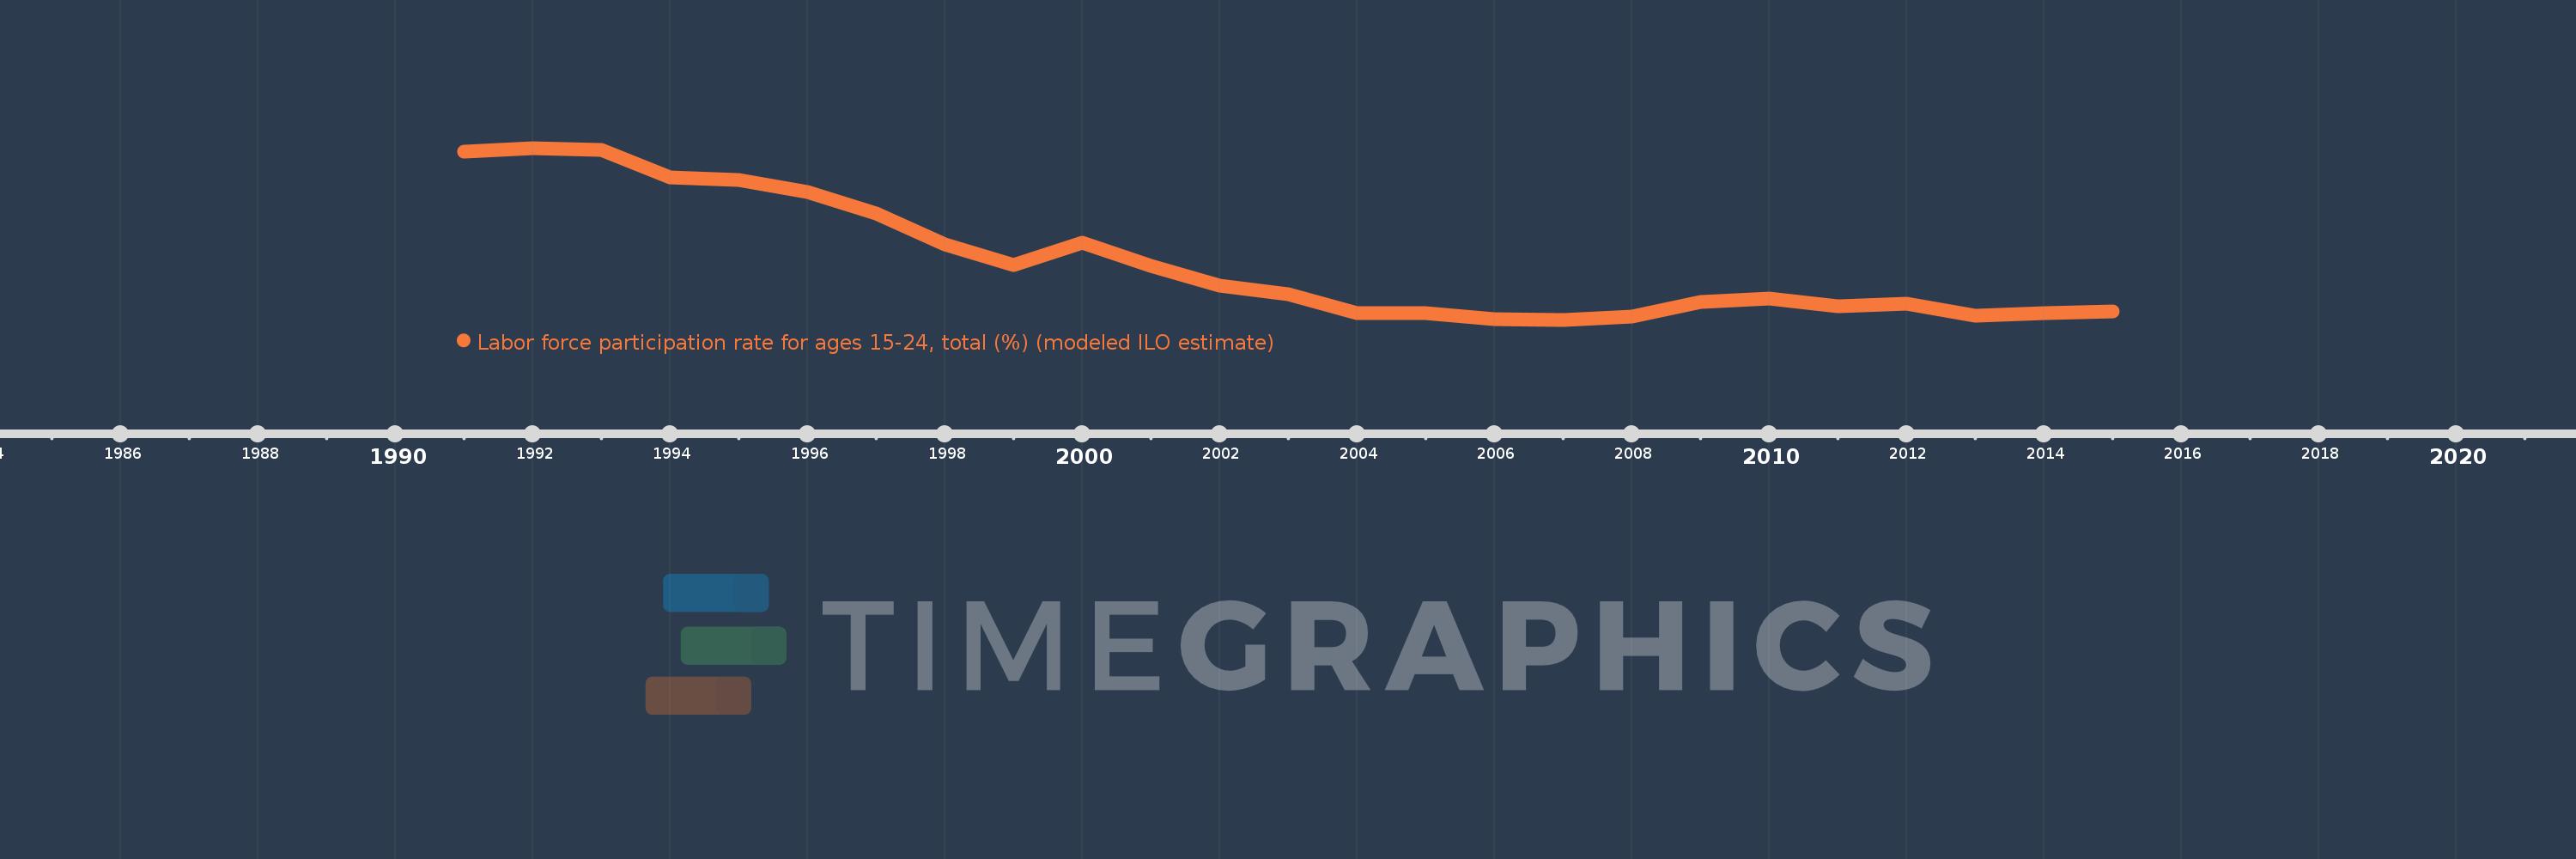
Labor force participation rate for ages 15-24, total (%) (modeled ILO estimate)
2015,2014,2013,2012,2011,2010,2009,2008,2007,2006,2005,2004,2003,2002,2001,2000,1999,1998,1997,1996,1995,1994,1993,1992,1991
Queste statistiche in altri paesi:
AfghanistanAlbaniaAlgeriaAngolaArab WorldArgentinaArmeniaAustraliaAustriaAzerbaijanBahamas, TheBahrainBangladeshBarbadosBelarusBelgiumBelizeBeninBhutanBoliviaBosnia and HerzegovinaBotswanaBrazilBrunei DarussalamBulgariaBurkina FasoBurundiCabo VerdeCambodiaCameroonCanadaCaribbean small statesCentral African RepublicCentral Europe and the BalticsChadChannel IslandsChileChinaColombiaComorosCongo, Dem. Rep.Congo, Rep.Costa RicaCote d'IvoireCroatiaCubaCyprusCzech RepublicDenmarkDjiboutiDominican RepublicEarly-demographic dividendEast Asia & PacificEast Asia & Pacific (excluding high income)East Asia & Pacific (IDA & IBRD countries)EcuadorEgypt, Arab Rep.El SalvadorEquatorial GuineaEritreaEstoniaEthiopiaEuro areaEurope & Central AsiaEurope & Central Asia (excluding high income)Europe & Central Asia (IDA & IBRD countries)European UnionFijiFinlandFragile and conflict affected situationsFranceFrench PolynesiaGabonGambia, TheGeorgiaGermanyGhanaGreeceGuamGuatemalaGuineaGuinea-BissauGuyanaHaitiHeavily indebted poor countries (HIPC)High incomeHondurasHong Kong SAR, ChinaHungaryIBRD onlyIcelandIDA & IBRD totalIDA blendIDA onlyIDA totalIndiaIndonesiaIran, Islamic Rep.IraqIrelandIsraelItalyJamaicaJapanJordanKazakhstanKenyaKorea, Dem. People’s Rep.Korea, Rep.KuwaitKyrgyz RepublicLao PDRLate-demographic dividendLatin America & Caribbean Latin America & Caribbean (excluding high income)Latin America & the Caribbean (IDA & IBRD countries)LatviaLeast developed countries: UN classificationLebanonLesothoLiberiaLibyaLithuaniaLow & middle incomeLow incomeLower middle incomeLuxembourgMacao SAR, ChinaMacedonia, FYRMadagascarMalawiMalaysiaMaldivesMaliMaltaMauritaniaMauritiusMexicoMiddle East & North AfricaMiddle East & North Africa (excluding high income)Middle East & North Africa (IDA & IBRD countries)Middle incomeMoldovaMongoliaMontenegroMoroccoMozambiqueMyanmarNamibiaNepalNetherlandsNew CaledoniaNew ZealandNicaraguaNigerNigeriaNorth AmericaNorwayOECD membersOmanOther small statesPacific island small statesPakistanPanamaPapua New GuineaParaguayPeruPhilippinesPolandPortugalPost-demographic dividendPre-demographic dividendPuerto RicoQatarRomaniaRussian FederationRwandaSamoaSao Tome and PrincipeSaudi ArabiaSenegalSerbiaSierra LeoneSingaporeSlovak RepublicSloveniaSmall statesSolomon IslandsSomaliaSouth AfricaSouth AsiaSouth Asia (IDA & IBRD)SpainSri LankaSt. LuciaSt. Vincent and the GrenadinesSub-Saharan Africa Sub-Saharan Africa (excluding high income)Sub-Saharan Africa (IDA & IBRD countries)SudanSurinameSwazilandSwedenSwitzerlandSyrian Arab RepublicTajikistanTanzaniaThailandTimor-LesteTogoTongaTrinidad and TobagoTunisiaTurkeyTurkmenistanUgandaUkraineUnited Arab EmiratesUnited KingdomUnited StatesUpper middle incomeUruguayUzbekistanVanuatuVenezuela, RBVietnamVirgin Islands (U.S.)West Bank and GazaWorldYemen, Rep.ZambiaZimbabwe Linea del tempo:
Questa scala temporale mostra un grafico dal 1991 anno al 2015 anno. Europe & Central Asia (excluding high income). I dati fino ad 1990 anno non disponibili. Il numero di osservazioni attuali secondo i date: 25.
La fonte (nome):
Indicatori dello sviluppo mondiale
La fonte (organizzazione):
International Labour Organization, Key Indicators of the Labour Market database.
Categorie:
Social Protection & Labor, Social Development
sono stati aggiornati
23 apr 2017 anni
Indicatori delle variazioni dei valori per anni
Minima:
39.624
1 gen 2007 anni
Massimo:
50.729
1 gen 1992 anni
Alla data di osservazione
Valore
Variazione assoluta
La variazione rispetto al valore precedente
1 gen 1991 anni
50.475
+50.475
0.0%
1 gen 1992 anni
50.729
+0.254
0.5%
1 gen 1993 anni
50.59
-0.139
-0.27%
1 gen 1994 anni
48.818
-1.772
-3.5%
1 gen 1995 anni
48.671
-0.147
-0.3%
1 gen 1996 anni
47.883
-0.788
-1.62%
1 gen 1997 anni
46.472
-1.411
-2.95%
1 gen 1998 anni
44.482
-1.99
-4.28%
1 gen 1999 anni
43.15
-1.332
-2.99%
1 gen 2000 anni
44.602
+1.452
3.36%
1 gen 2001 anni
43.113
-1.489
-3.34%
1 gen 2002 anni
41.829
-1.284
-2.98%
1 gen 2003 anni
41.295
-0.533
-1.28%
1 gen 2004 anni
40.054
-1.241
-3.01%
1 gen 2005 anni
40.067
+0.013
0.03%
1 gen 2006 anni
39.658
-0.409
-1.02%
1 gen 2007 anni
39.624
-0.034
-0.08%
1 gen 2008 anni
39.808
+0.183
0.46%
1 gen 2009 anni
40.79
+0.982
2.47%
1 gen 2010 anni
40.99
+0.2
0.49%
1 gen 2011 anni
40.491
-0.499
-1.22%
1 gen 2012 anni
40.648
+0.157
0.39%
1 gen 2013 anni
39.882
-0.765
-1.88%
1 gen 2014 anni
40.034
+0.152
0.38%
1 gen 2015 anni
40.148
+0.114
0.28%
Classificazione dei paesi secondo i statistiche attuali per anni


Commenti: