30
/it/
AIzaSyAYiBZKx7MnpbEhh9jyipgxe19OcubqV5w
April 1, 2024
31501
Europe & Central Asia (excluding high income)
ECA
false
2
1
Employment in industry, female (% of female employment)
2015,2014,2013,2012,2011,2010,2009,2008,2007,2006,2005,2004,2003,2002,2000
Download
Biblioteca di statistiche globali →Europe & Central Asia (excluding high income) →

Employment in industry, female (% of female employment)

Queste statistiche in altri paesi:

AlbaniaAlgeriaAmerican SamoaAntigua and BarbudaArab WorldArgentinaArmeniaArubaAustraliaAustriaAzerbaijanBahamas, TheBahrainBangladeshBarbadosBelarusBelgiumBelizeBeninBermudaBhutanBoliviaBotswanaBrazilBritish Virgin IslandsBrunei DarussalamBulgariaBurkina FasoBurundiCambodiaCameroonCanadaCaribbean small statesCayman IslandsCentral Europe and the BalticsChadChileChinaColombiaCongo, Rep.Costa RicaCroatiaCubaCyprusCzech RepublicDenmarkDominicaDominican RepublicEarly-demographic dividendEast Asia & PacificEast Asia & Pacific (excluding high income)East Asia & Pacific (IDA & IBRD countries)EcuadorEgypt, Arab Rep.El SalvadorEquatorial GuineaEstoniaEthiopiaEuro areaEurope & Central AsiaEurope & Central Asia (excluding high income)Europe & Central Asia (IDA & IBRD countries)European UnionFaroe IslandsFijiFinlandFranceGabonGambia, TheGeorgiaGermanyGhanaGreeceGreenlandGrenadaGuatemalaGuineaGuyanaHaitiHigh incomeHondurasHong Kong SAR, ChinaHungaryIBRD onlyIcelandIDA & IBRD totalIDA blendIndiaIndonesiaIran, Islamic Rep.IraqIrelandIsle of ManIsraelItalyJamaicaJapanJordanKazakhstanKenyaKiribatiKorea, Rep.KosovoKuwaitKyrgyz RepublicLao PDRLate-demographic dividendLatin America & Caribbean Latin America & Caribbean (excluding high income)Latin America & the Caribbean (IDA & IBRD countries)LatviaLesothoLiberiaLithuaniaLow & middle incomeLower middle incomeLuxembourgMacao SAR, ChinaMacedonia, FYRMadagascarMalawiMalaysiaMaldivesMaliMaltaMarshall IslandsMauritiusMexicoMiddle East & North AfricaMiddle East & North Africa (excluding high income)Middle East & North Africa (IDA & IBRD countries)Middle incomeMoldovaMongoliaMontenegroMoroccoMozambiqueNamibiaNepalNetherlandsNew CaledoniaNew ZealandNicaraguaNigerNigeriaNorth AmericaNorthern Mariana IslandsNorwayOECD membersOmanPakistanPalauPanamaParaguayPeruPhilippinesPolandPortugalPost-demographic dividendPuerto RicoQatarRomaniaRussian FederationRwandaSamoaSan MarinoSao Tome and PrincipeSaudi ArabiaSenegalSerbiaSeychellesSierra LeoneSingaporeSlovak RepublicSloveniaSouth AfricaSouth AsiaSouth Asia (IDA & IBRD)SpainSri LankaSt. Kitts and NevisSt. LuciaSt. Vincent and the GrenadinesSudanSurinameSwedenSwitzerlandSyrian Arab RepublicTajikistanTanzaniaThailandTimor-LesteTogoTongaTrinidad and TobagoTunisiaTurkeyUgandaUkraineUnited Arab EmiratesUnited KingdomUnited StatesUpper middle incomeUruguayVanuatuVenezuela, RBVietnamWest Bank and GazaWorldYemen, Rep.ZambiaZimbabwe

Linea del tempo:

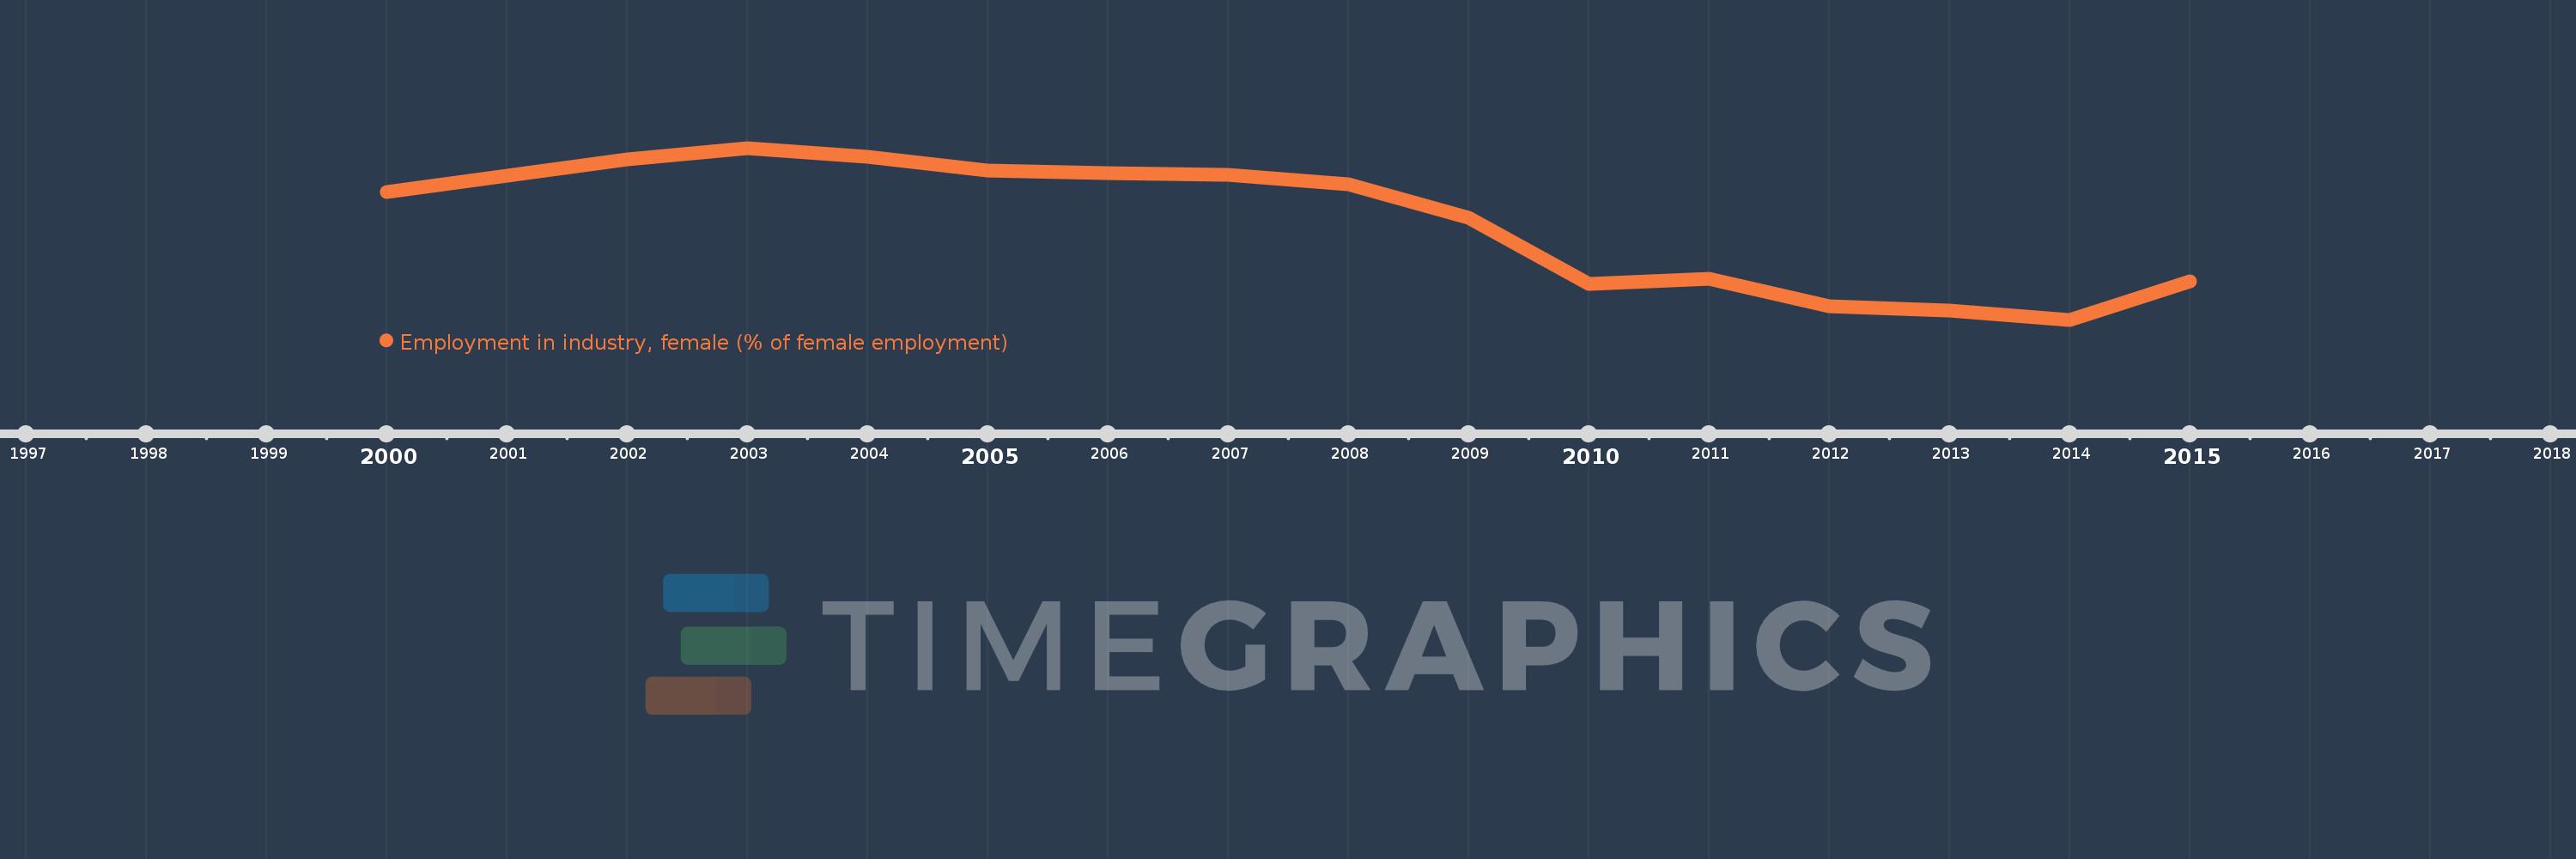
Questa scala temporale mostra un grafico dal 2000 anno al 2015 anno. Europe & Central Asia (excluding high income). I dati fino ad 1999 anno non disponibili. Il numero di osservazioni attuali secondo i date: 15.

La fonte (nome):

Indicatori dello sviluppo mondiale

La fonte (organizzazione):

International Labour Organization, Key Indicators of the Labour Market database.

Categorie:

Social Protection & Labor, Gender

sono stati aggiornati

23 apr 2017 anni

Indicatori delle variazioni dei valori per anni

In media:
18.231
Minima:
15.957
1 gen 2014 anni
Massimo:
20.029
1 gen 2003 anni
Alla data di osservazione
Valore
Variazione assoluta
La variazione rispetto al valore precedente
1 gen 2000 anni
18.985
+18.985
0.0%
1 gen 2002 anni
19.767
+0.781
4.12%
1 gen 2003 anni
20.029
+0.263
1.33%
1 gen 2004 anni
19.829
-0.2
-1.0%
1 gen 2005 anni
19.501
-0.327
-1.65%
1 gen 2006 anni
19.43
-0.071
-0.36%
1 gen 2007 anni
19.397
-0.034
-0.17%
1 gen 2008 anni
19.165
-0.232
-1.2%
1 gen 2009 anni
18.377
-0.788
-4.11%
1 gen 2010 anni
16.798
-1.579
-8.59%
1 gen 2011 anni
16.922
+0.125
0.74%
1 gen 2012 anni
16.273
-0.649
-3.84%
1 gen 2013 anni
16.175
-0.098
-0.6%
1 gen 2014 anni
15.957
-0.218
-1.35%
1 gen 2015 anni
16.862
+0.904
5.67%

Classificazione dei paesi secondo i statistiche attuali per anni