29
/it/
it
AIzaSyAYiBZKx7MnpbEhh9jyipgxe19OcubqV5w
April 1, 2024
31248
Europe & Central Asia
ECS
false
2
1
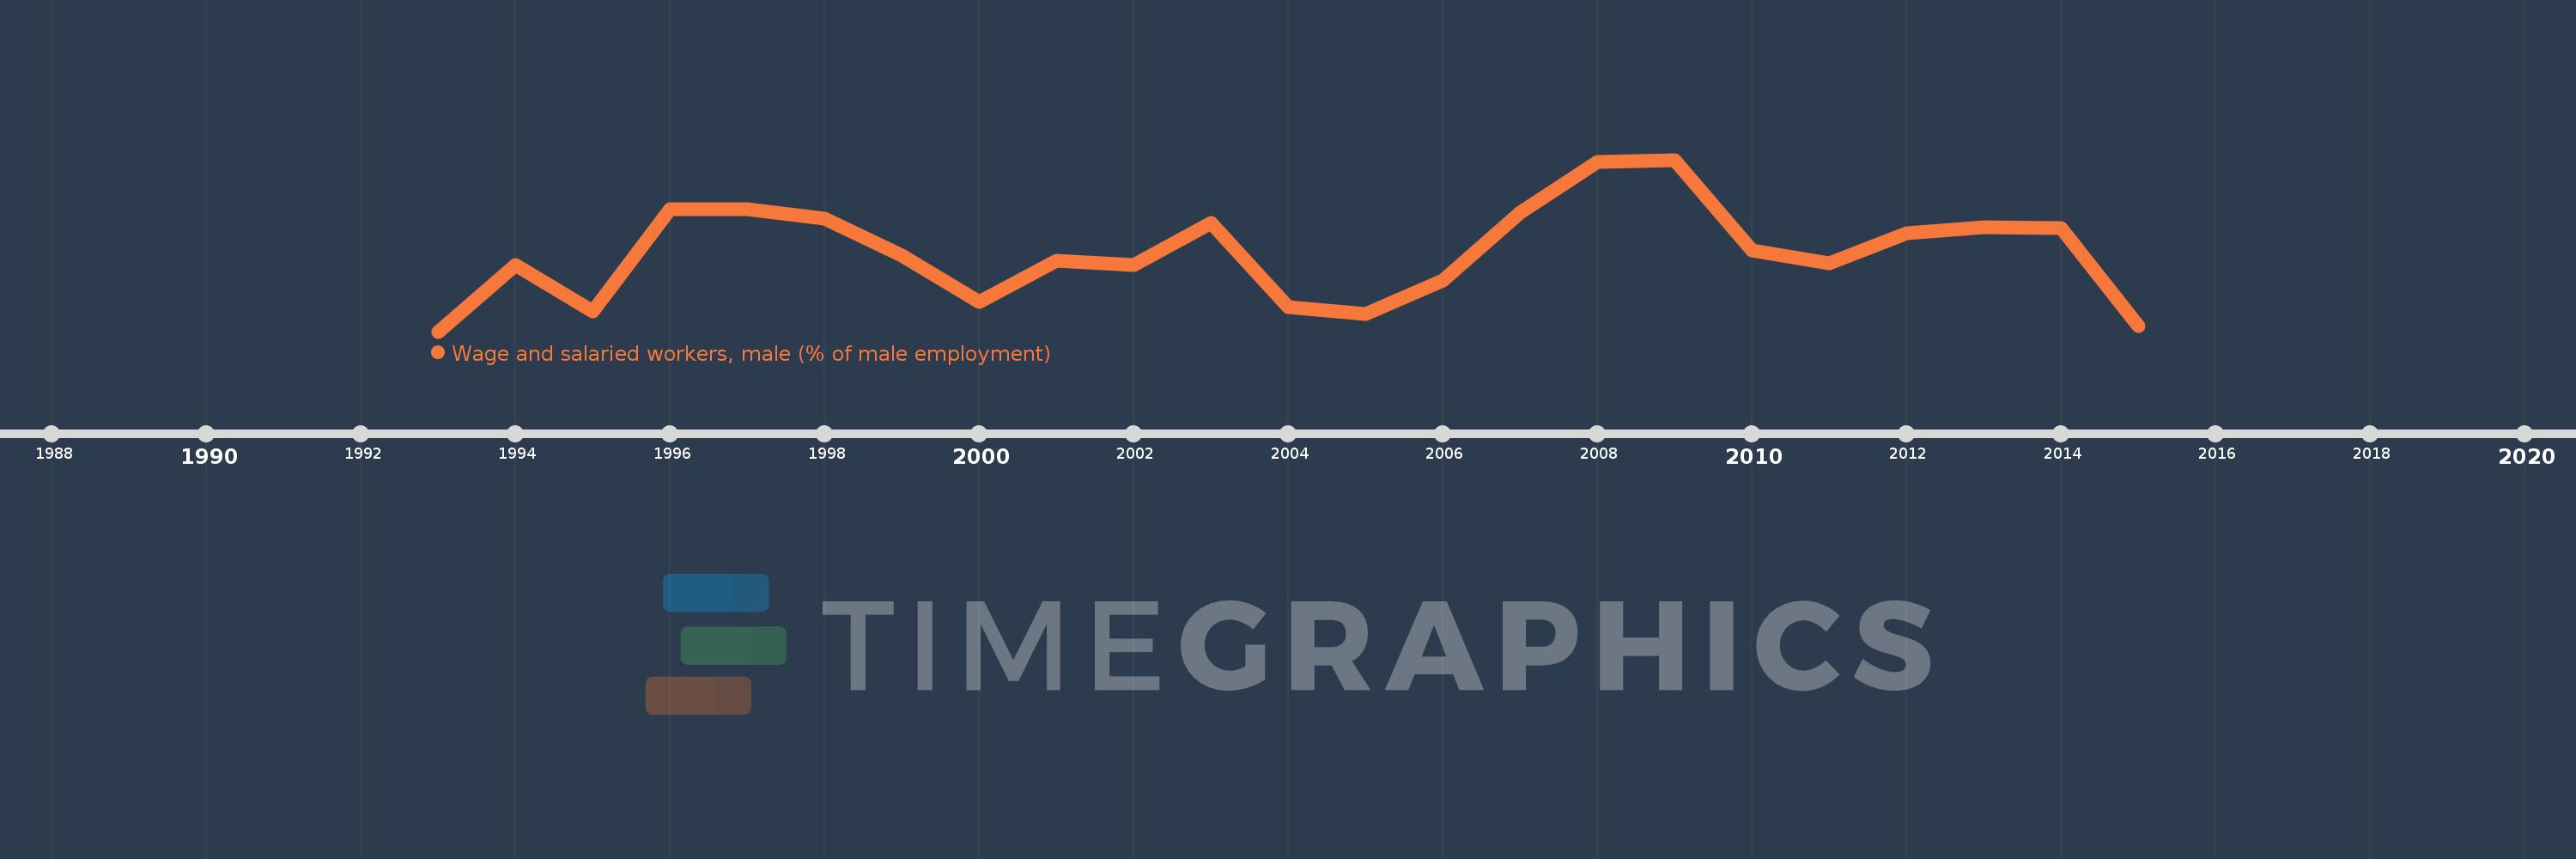
Wage and salaried workers, male (% of male employment)
2015,2014,2013,2012,2011,2010,2009,2008,2007,2006,2005,2004,2003,2002,2001,2000,1999,1998,1997,1996,1995,1994,1993
Queste statistiche in altri paesi:
AlbaniaAlgeriaAmerican SamoaAntigua and BarbudaArgentinaArmeniaArubaAustraliaAustriaAzerbaijanBahamas, TheBahrainBangladeshBarbadosBelarusBelgiumBelizeBeninBermudaBhutanBoliviaBosnia and HerzegovinaBotswanaBrazilBritish Virgin IslandsBrunei DarussalamBulgariaBurkina FasoBurundiCabo VerdeCambodiaCameroonCanadaCaribbean small statesCayman IslandsCentral Europe and the BalticsChadChileColombiaCongo, Rep.Costa RicaCote d'IvoireCroatiaCubaCyprusCzech RepublicDenmarkDjiboutiDominicaDominican RepublicEarly-demographic dividendEcuadorEgypt, Arab Rep.El SalvadorEquatorial GuineaEstoniaEthiopiaEuro areaEurope & Central AsiaEurope & Central Asia (excluding high income)Europe & Central Asia (IDA & IBRD countries)European UnionFijiFinlandFranceFrench PolynesiaGabonGambia, TheGeorgiaGermanyGhanaGreeceGrenadaGuatemalaGuineaGuyanaHaitiHigh incomeHondurasHong Kong SAR, ChinaHungaryIcelandIndiaIndonesiaIran, Islamic Rep.IrelandIsle of ManIsraelItalyJamaicaJapanJordanKazakhstanKenyaKiribatiKorea, Rep.KosovoKuwaitKyrgyz RepublicLao PDRLatin America & Caribbean Latin America & Caribbean (excluding high income)Latin America & the Caribbean (IDA & IBRD countries)LatviaLebanonLesothoLiberiaLithuaniaLower middle incomeLuxembourgMacao SAR, ChinaMacedonia, FYRMadagascarMalawiMalaysiaMaldivesMaliMaltaMarshall IslandsMauritiusMexicoMiddle East & North AfricaMiddle East & North Africa (excluding high income)Middle East & North Africa (IDA & IBRD countries)MoldovaMongoliaMontenegroMoroccoMozambiqueNamibiaNepalNetherlandsNew CaledoniaNew ZealandNicaraguaNigerNorth AmericaNorwayOECD membersOmanPakistanPanamaParaguayPeruPhilippinesPolandPortugalPost-demographic dividendPuerto RicoQatarRomaniaRussian FederationRwandaSamoaSan MarinoSao Tome and PrincipeSaudi ArabiaSenegalSerbiaSeychellesSierra LeoneSingaporeSlovak RepublicSloveniaSouth AfricaSouth AsiaSouth Asia (IDA & IBRD)SpainSri LankaSt. Kitts and NevisSt. LuciaSt. Vincent and the GrenadinesSurinameSwazilandSwedenSwitzerlandSyrian Arab RepublicTajikistanTanzaniaThailandTimor-LesteTogoTongaTrinidad and TobagoTunisiaTurkeyTurks and Caicos IslandsTuvaluUgandaUkraineUnited Arab EmiratesUnited KingdomUnited StatesUruguayVanuatuVenezuela, RBVietnamWest Bank and GazaYemen, Rep.ZambiaZimbabwe Linea del tempo:
Questa scala temporale mostra un grafico dal 1993 anno al 2015 anno. Europe & Central Asia. I dati fino ad 1992 anno non disponibili. Il numero di osservazioni attuali secondo i date: 23.
La fonte (nome):
Indicatori dello sviluppo mondiale
La fonte (organizzazione):
International Labour Organization, Key Indicators of the Labour Market database.
Categorie:
Social Protection & Labor, Gender
sono stati aggiornati
23 apr 2017 anni
Indicatori delle variazioni dei valori per anni
Minima:
78.806
1 gen 1993 anni
Massimo:
80.194
1 gen 2009 anni
Alla data di osservazione
Valore
Variazione assoluta
La variazione rispetto al valore precedente
1 gen 1993 anni
78.806
+78.806
0.0%
1 gen 1994 anni
79.341
+0.535
0.68%
1 gen 1995 anni
78.968
-0.373
-0.47%
1 gen 1996 anni
79.793
+0.826
1.05%
1 gen 1997 anni
79.795
+0.001
0.0%
1 gen 1998 anni
79.716
-0.079
-0.1%
1 gen 1999 anni
79.421
-0.294
-0.37%
1 gen 2000 anni
79.045
-0.377
-0.47%
1 gen 2001 anni
79.38
+0.336
0.43%
1 gen 2002 anni
79.347
-0.034
-0.04%
1 gen 2003 anni
79.681
+0.334
0.42%
1 gen 2004 anni
79.002
-0.679
-0.85%
1 gen 2005 anni
78.951
-0.051
-0.06%
1 gen 2006 anni
79.218
+0.267
0.34%
1 gen 2007 anni
79.767
+0.549
0.69%
1 gen 2008 anni
80.178
+0.41
0.51%
1 gen 2009 anni
80.194
+0.017
0.02%
1 gen 2010 anni
79.462
-0.732
-0.91%
1 gen 2011 anni
79.357
-0.105
-0.13%
1 gen 2012 anni
79.601
+0.244
0.31%
1 gen 2013 anni
79.648
+0.047
0.06%
1 gen 2014 anni
79.645
-0.003
0.0%
1 gen 2015 anni
78.852
-0.793
-1.0%
Classificazione dei paesi secondo i statistiche attuali per anni


Commenti: