29
/it/
it
AIzaSyAYiBZKx7MnpbEhh9jyipgxe19OcubqV5w
April 1, 2024
30639
Europe & Central Asia
ECS
false
2
1
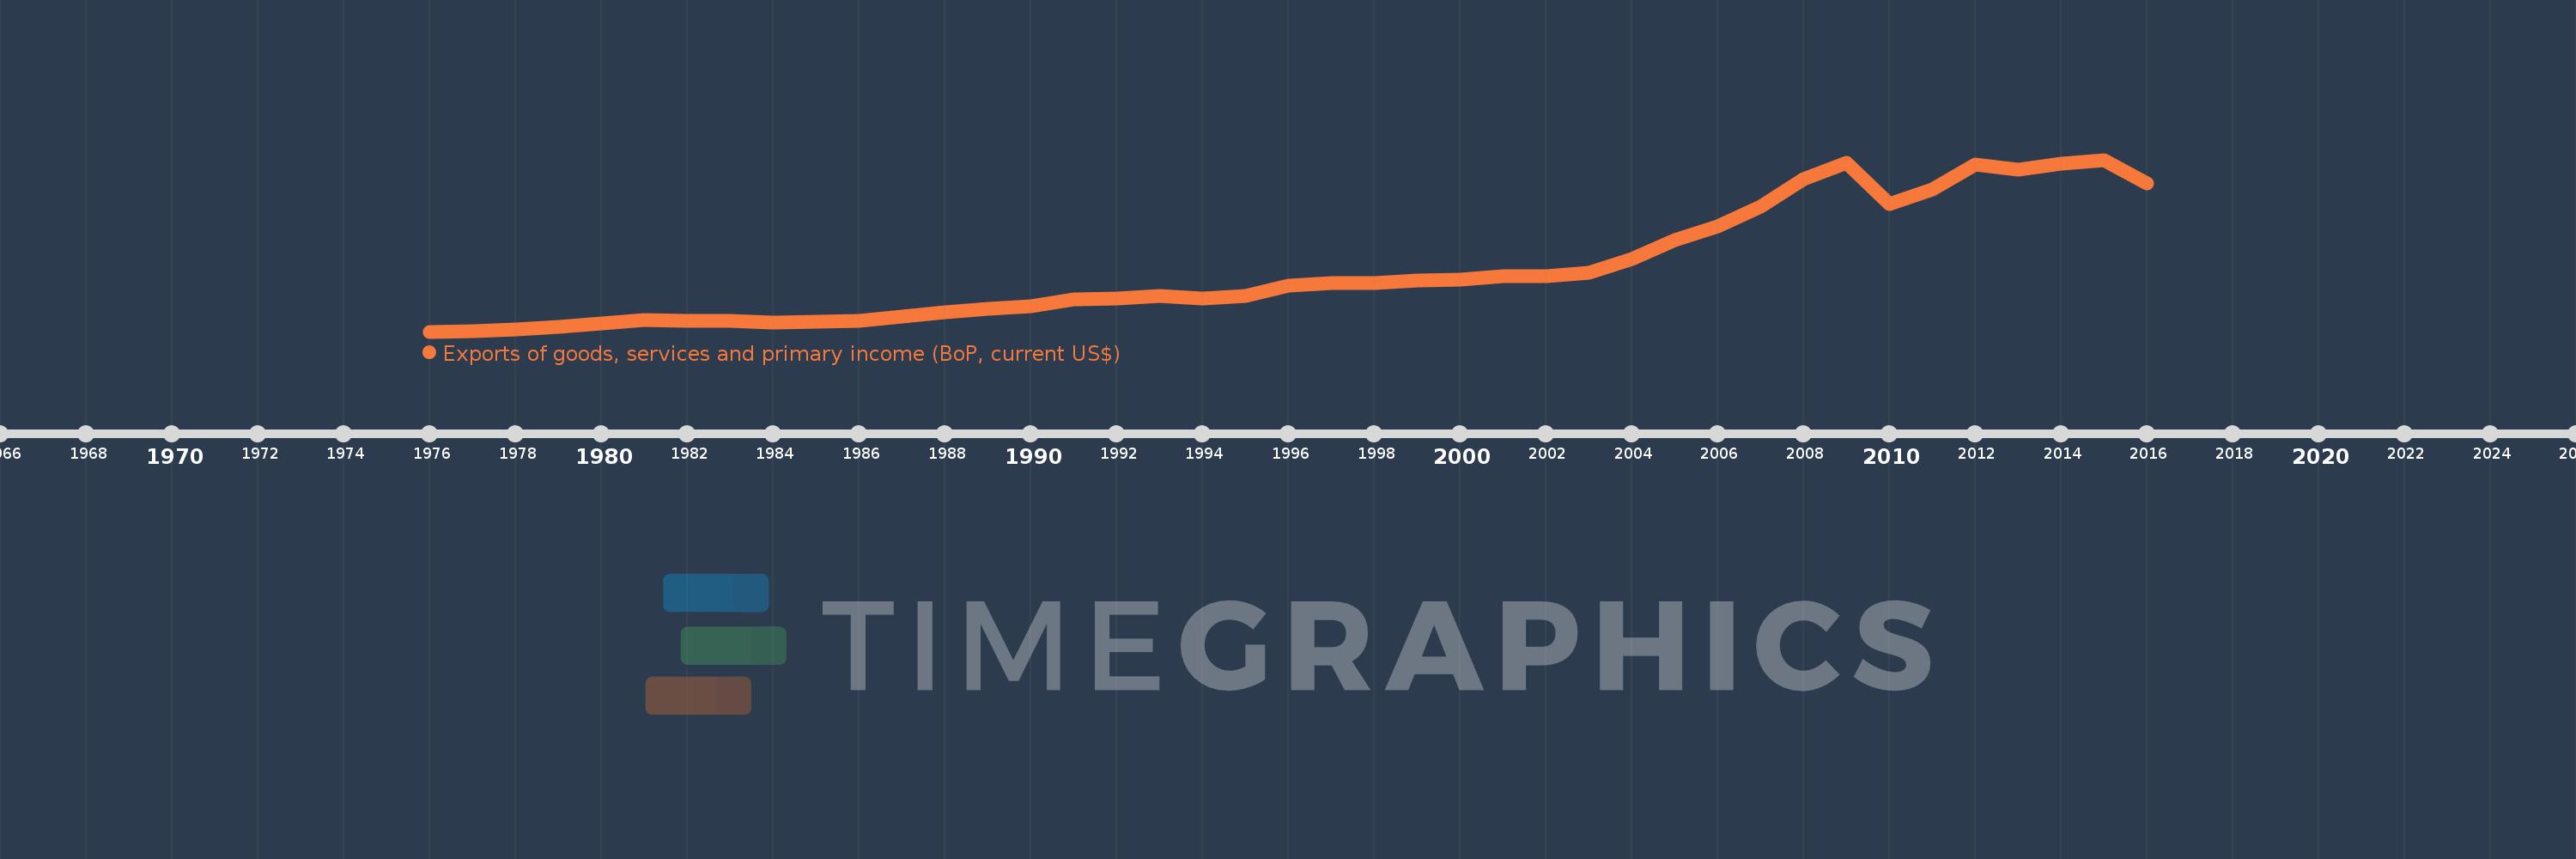
Exports of goods, services and primary income (BoP, current US$)
2016,2015,2014,2013,2012,2011,2010,2009,2008,2007,2006,2005,2004,2003,2002,2001,2000,1999,1998,1997,1996,1995,1994,1993,1992,1991,1990,1989,1988,1987,1986,1985,1984,1983,1982,1981,1980,1979,1978,1977,1976
Queste statistiche in altri paesi:
AfghanistanAlbaniaAlgeriaAngolaAntigua and BarbudaArab WorldArgentinaArmeniaArubaAustraliaAustriaAzerbaijanBahamas, TheBahrainBangladeshBarbadosBelarusBelgiumBelizeBeninBermudaBhutanBoliviaBosnia and HerzegovinaBotswanaBrazilBrunei DarussalamBulgariaBurkina FasoBurundiCabo VerdeCambodiaCameroonCanadaCaribbean small statesCentral African RepublicCentral Europe and the BalticsChadChileChinaColombiaComorosCongo, Dem. Rep.Congo, Rep.Costa RicaCote d'IvoireCroatiaCuracaoCyprusCzech RepublicDenmarkDjiboutiDominicaDominican RepublicEarly-demographic dividendEast Asia & PacificEast Asia & Pacific (excluding high income)East Asia & Pacific (IDA & IBRD countries)EcuadorEgypt, Arab Rep.El SalvadorEquatorial GuineaEritreaEstoniaEthiopiaEuro areaEurope & Central AsiaEurope & Central Asia (excluding high income)Europe & Central Asia (IDA & IBRD countries)European UnionFaroe IslandsFijiFinlandFragile and conflict affected situationsFranceFrench PolynesiaGabonGambia, TheGeorgiaGermanyGhanaGreeceGrenadaGuatemalaGuineaGuinea-BissauGuyanaHaitiHeavily indebted poor countries (HIPC)High incomeHondurasHong Kong SAR, ChinaHungaryIBRD onlyIcelandIDA & IBRD totalIDA blendIDA onlyIDA totalIndiaIndonesiaIran, Islamic Rep.IraqIrelandIsraelItalyJamaicaJapanJordanKazakhstanKenyaKiribatiKorea, Rep.KosovoKuwaitKyrgyz RepublicLao PDRLate-demographic dividendLatin America & Caribbean Latin America & Caribbean (excluding high income)Latin America & the Caribbean (IDA & IBRD countries)LatviaLeast developed countries: UN classificationLebanonLesothoLiberiaLibyaLithuaniaLow & middle incomeLow incomeLower middle incomeLuxembourgMacao SAR, ChinaMacedonia, FYRMadagascarMalawiMalaysiaMaldivesMaliMaltaMarshall IslandsMauritaniaMauritiusMexicoMicronesia, Fed. Sts.Middle East & North Africa (excluding high income)Middle East & North Africa (IDA & IBRD countries)Middle incomeMoldovaMongoliaMontenegroMoroccoMozambiqueMyanmarNamibiaNepalNetherlandsNew CaledoniaNicaraguaNigerNigeriaNorth AmericaNorwayOECD membersOmanPacific island small statesPakistanPalauPanamaPapua New GuineaParaguayPeruPhilippinesPolandPortugalPost-demographic dividendPre-demographic dividendQatarRomaniaRussian FederationRwandaSamoaSao Tome and PrincipeSaudi ArabiaSenegalSerbiaSeychellesSierra LeoneSingaporeSint Maarten (Dutch part)Slovak RepublicSloveniaSolomon IslandsSouth AfricaSouth AsiaSouth Asia (IDA & IBRD)South SudanSpainSri LankaSt. Kitts and NevisSt. LuciaSt. Vincent and the GrenadinesSub-Saharan Africa Sub-Saharan Africa (excluding high income)Sub-Saharan Africa (IDA & IBRD countries)SudanSurinameSwazilandSwedenSwitzerlandSyrian Arab RepublicTajikistanTanzaniaThailandTimor-LesteTogoTongaTrinidad and TobagoTunisiaTurkeyTuvaluUgandaUkraineUnited KingdomUnited StatesUpper middle incomeUruguayVanuatuVenezuela, RBVietnamWest Bank and GazaWorldYemen, Rep.ZambiaZimbabwe Linea del tempo:
Questa scala temporale mostra un grafico dal 1976 anno al 2016 anno. Europe & Central Asia. I dati fino ad 1975 anno non disponibili. Il numero di osservazioni attuali secondo i date: 41.
La fonte (nome):
Indicatori dello sviluppo mondiale
La fonte (organizzazione):
International Monetary Fund, Balance of Payments Statistics Yearbook and data files.
Categorie:
Economy & Growth, External Debt, Trade
sono stati aggiornati
23 apr 2017 anni
Indicatori delle variazioni dei valori per anni
Minima:
577.237 Mlrd
1 gen 1976 anni
Massimo:
11.85 Trln
1 gen 2015 anni
Alla data di osservazione
Valore
Variazione assoluta
La variazione rispetto al valore precedente
1 gen 1976 anni
577.237 Mlrd
+577.237 Mlrd
0.0%
1 gen 1977 anni
630.556 Mlrd
+53.319 Mlrd
9.24%
1 gen 1978 anni
724.229 Mlrd
+93.673 Mlrd
14.86%
1 gen 1979 anni
889.749 Mlrd
+165.52 Mlrd
22.85%
1 gen 1980 anni
1.127 Trln
+237.34 Mlrd
26.67%
1 gen 1981 anni
1.328 Trln
+201.236 Mlrd
17.85%
1 gen 1982 anni
1.3 Trln
-28.377 Mlrd
-2.14%
1 gen 1983 anni
1.256 Trln
-43.568 Mlrd
-3.35%
1 gen 1984 anni
1.197 Trln
-59.686 Mlrd
-4.75%
1 gen 1985 anni
1.235 Trln
+38.149 Mlrd
3.19%
1 gen 1986 anni
1.286 Trln
+50.966 Mlrd
4.13%
1 gen 1987 anni
1.539 Trln
+253.188 Mlrd
19.69%
1 gen 1988 anni
1.838 Trln
+298.511 Mlrd
19.4%
1 gen 1989 anni
2.068 Trln
+230.351 Mlrd
12.54%
1 gen 1990 anni
2.231 Trln
+163.541 Mlrd
7.91%
1 gen 1991 anni
2.715 Trln
+483.475 Mlrd
21.67%
1 gen 1992 anni
2.732 Trln
+16.741 Mlrd
0.62%
1 gen 1993 anni
2.928 Trln
+196.658 Mlrd
7.2%
1 gen 1994 anni
2.75 Trln
-178.23 Mlrd
-6.09%
1 gen 1995 anni
2.94 Trln
+189.622 Mlrd
6.9%
1 gen 1996 anni
3.586 Trln
+646.243 Mlrd
21.98%
1 gen 1997 anni
3.754 Trln
+167.979 Mlrd
4.68%
1 gen 1998 anni
3.787 Trln
+33.122 Mlrd
0.88%
1 gen 1999 anni
3.913 Trln
+125.719 Mlrd
3.32%
1 gen 2000 anni
3.972 Trln
+59.473 Mlrd
1.52%
1 gen 2001 anni
4.213 Trln
+240.328 Mlrd
6.05%
1 gen 2002 anni
4.233 Trln
+20.054 Mlrd
0.48%
1 gen 2003 anni
4.429 Trln
+196.654 Mlrd
4.65%
1 gen 2004 anni
5.315 Trln
+885.635 Mlrd
20.0%
1 gen 2005 anni
6.603 Trln
+1.288 Trln
24.24%
1 gen 2006 anni
7.493 Trln
+889.818 Mlrd
13.48%
1 gen 2007 anni
8.758 Trln
+1.265 Trln
16.88%
1 gen 2008 anni
10.598 Trln
+1.84 Trln
21.02%
1 gen 2009 anni
11.625 Trln
+1.027 Trln
9.69%
1 gen 2010 anni
8.962 Trln
-2.663 Trln
-22.91%
1 gen 2011 anni
9.88 Trln
+918.003 Mlrd
10.24%
1 gen 2012 anni
11.551 Trln
+1.671 Trln
16.91%
1 gen 2013 anni
11.191 Trln
-360.08 Mlrd
-3.12%
1 gen 2014 anni
11.608 Trln
+417.333 Mlrd
3.73%
1 gen 2015 anni
11.85 Trln
+241.585 Mlrd
2.08%
1 gen 2016 anni
10.275 Trln
-1.575 Trln
-13.29%
Classificazione dei paesi secondo i statistiche attuali per anni


Commenti: