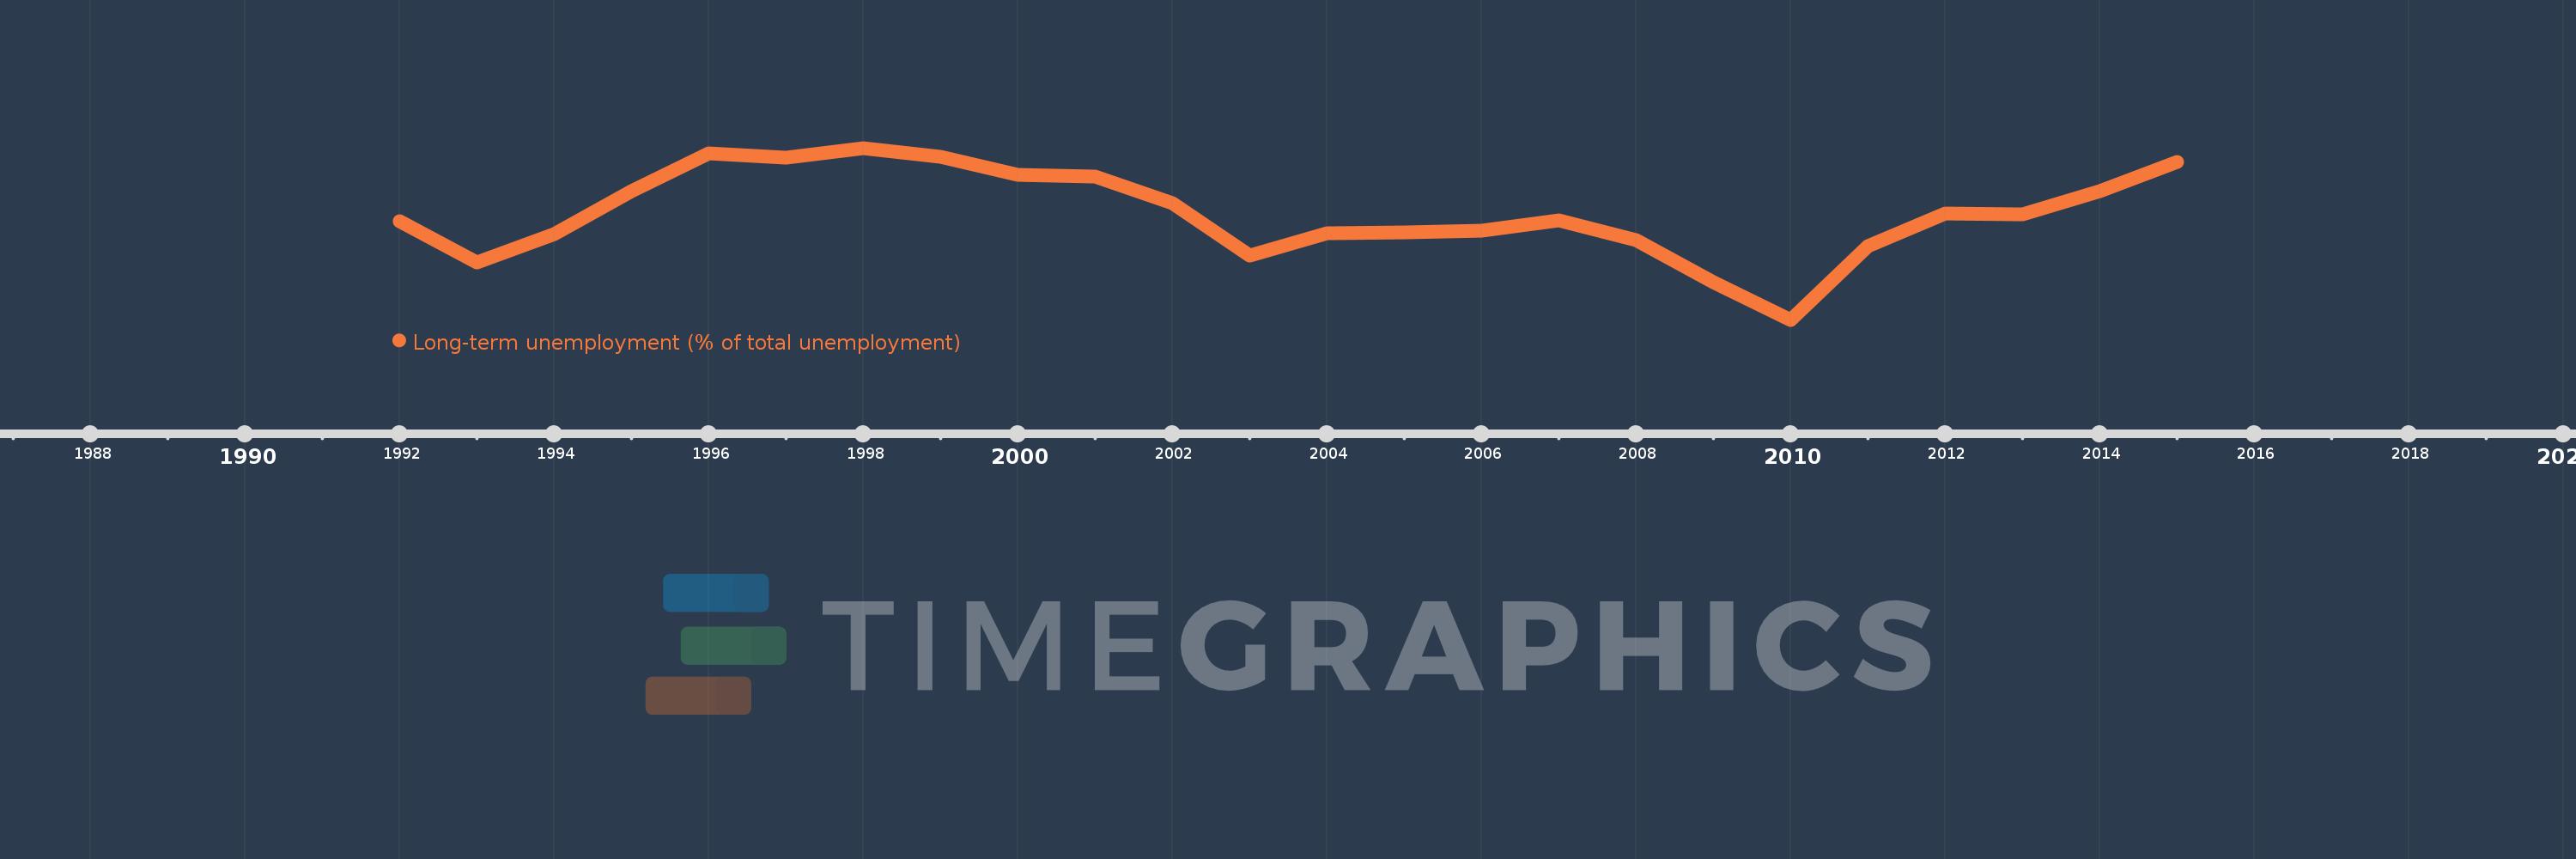
Questa scala temporale mostra un grafico dal 1992 anno al 2015 anno. Euro area. I dati fino ad 1991 anno non disponibili. Il numero di osservazioni attuali secondo i date: 24.
La fonte (nome):
Indicatori dello sviluppo mondiale
La fonte (organizzazione):
International Labour Organization, Key Indicators of the Labour Market database.
Categorie:
Social Protection & Labor
sono stati aggiornati
23 apr 2017 anni
Indicatori delle variazioni dei valori per anni
In media:
44.835
Minima:
36.69
1 gen 2010 anni
Massimo:
49.844
1 gen 1998 anni
Alla data di osservazione
Valore
Variazione assoluta
La variazione rispetto al valore precedente
1 gen 1992 anni
44.264
+44.264
0.0%
1 gen 1993 anni
41.104
-3.161
-7.14%
1 gen 1994 anni
43.241
+2.137
5.2%
1 gen 1995 anni
46.513
+3.272
7.57%
1 gen 1996 anni
49.431
+2.918
6.27%
1 gen 1997 anni
49.11
-0.321
-0.65%
1 gen 1998 anni
49.844
+0.734
1.5%
1 gen 1999 anni
49.136
-0.708
-1.42%
1 gen 2000 anni
47.765
-1.371
-2.79%
1 gen 2001 anni
47.664
-0.101
-0.21%
1 gen 2002 anni
45.624
-2.04
-4.28%
1 gen 2003 anni
41.606
-4.018
-8.81%
1 gen 2004 anni
43.318
+1.711
4.11%
1 gen 2005 anni
43.387
+0.069
0.16%
1 gen 2006 anni
43.493
+0.107
0.25%
1 gen 2007 anni
44.297
+0.804
1.85%
1 gen 2008 anni
42.777
-1.52
-3.43%
1 gen 2009 anni
39.532
-3.245
-7.59%
1 gen 2010 anni
36.69
-2.842
-7.19%
1 gen 2011 anni
42.356
+5.666
15.44%
1 gen 2012 anni
44.834
+2.477
5.85%
1 gen 2013 anni
44.746
-0.088
-0.2%
1 gen 2014 anni
46.531
+1.785
3.99%
1 gen 2015 anni
48.779
+2.247
4.83%
Classificazione dei paesi secondo i statistiche attuali per anni
