Download Queste statistiche in altri paesi:
Linea del tempo:
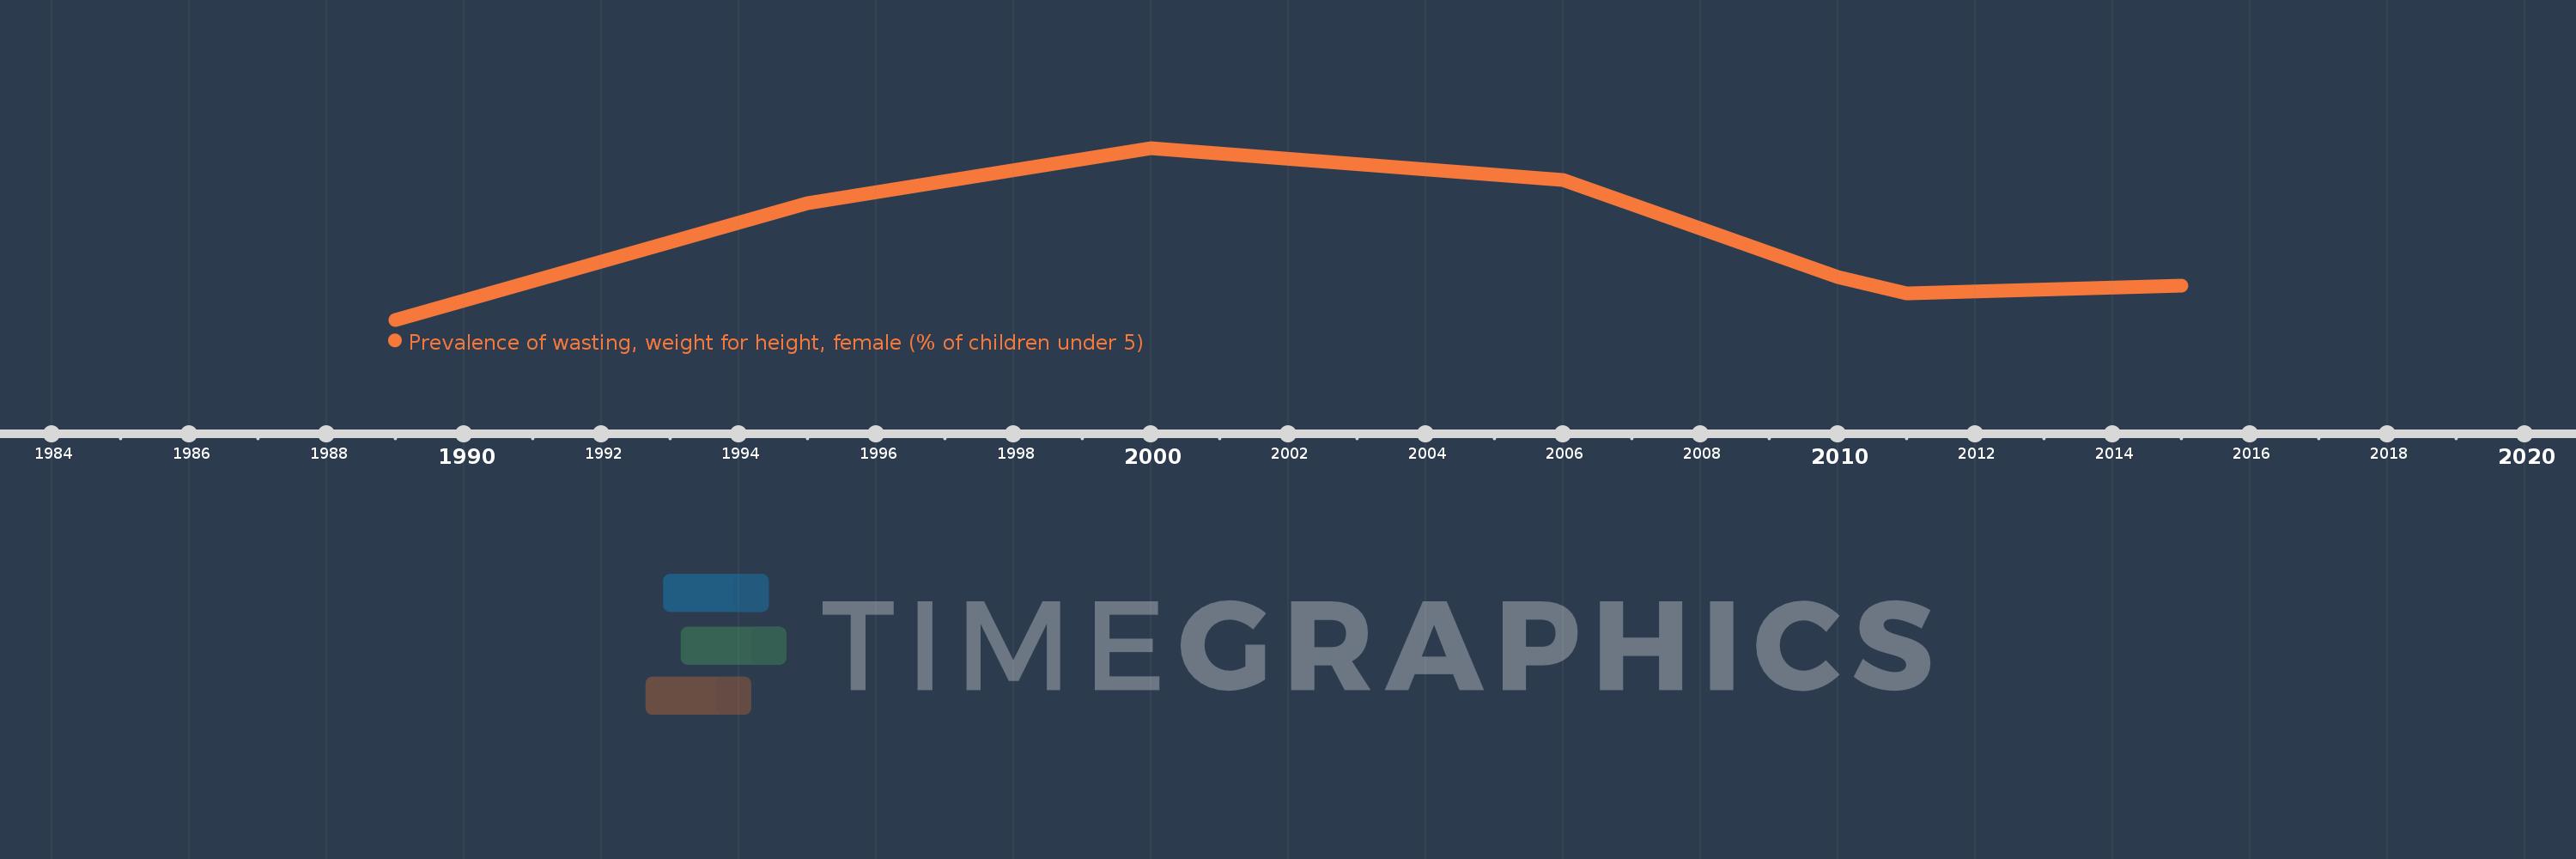
Questa scala temporale mostra un grafico dal 1989 anno al 2015 anno. Zimbabwe. I dati fino ad 1988 anno non disponibili. Il numero di osservazioni attuali secondo i date: 7.
La fonte (nome):
Indicatori dello sviluppo mondiale
La fonte (organizzazione):
World Health Organization, Global Database on Child Growth and Malnutrition. Country-level data are unadjusted data from national surveys, and thus may not be comparable across countries.
Categorie:
Health
sono stati aggiornati
23 apr 2017 anni
Indicatori delle variazioni dei valori per anni
Minima:
1.6
1 gen 1989 anni
Massimo:
8.1
1 gen 2000 anni
Alla data di osservazione
Valore
Variazione assoluta
La variazione rispetto al valore precedente
1 gen 1989 anni
1.6
+1.6
0.0%
1 gen 1995 anni
6.0
+4.4
275.0%
1 gen 2000 anni
8.1
+2.1
35.0%
1 gen 2006 anni
6.9
-1.2
-14.81%
1 gen 2010 anni
3.2
-3.7
-53.62%
1 gen 2011 anni
2.6
-0.6
-18.75%
1 gen 2015 anni
2.9
+0.3
11.54%
Classificazione dei paesi secondo i statistiche attuali per anni
