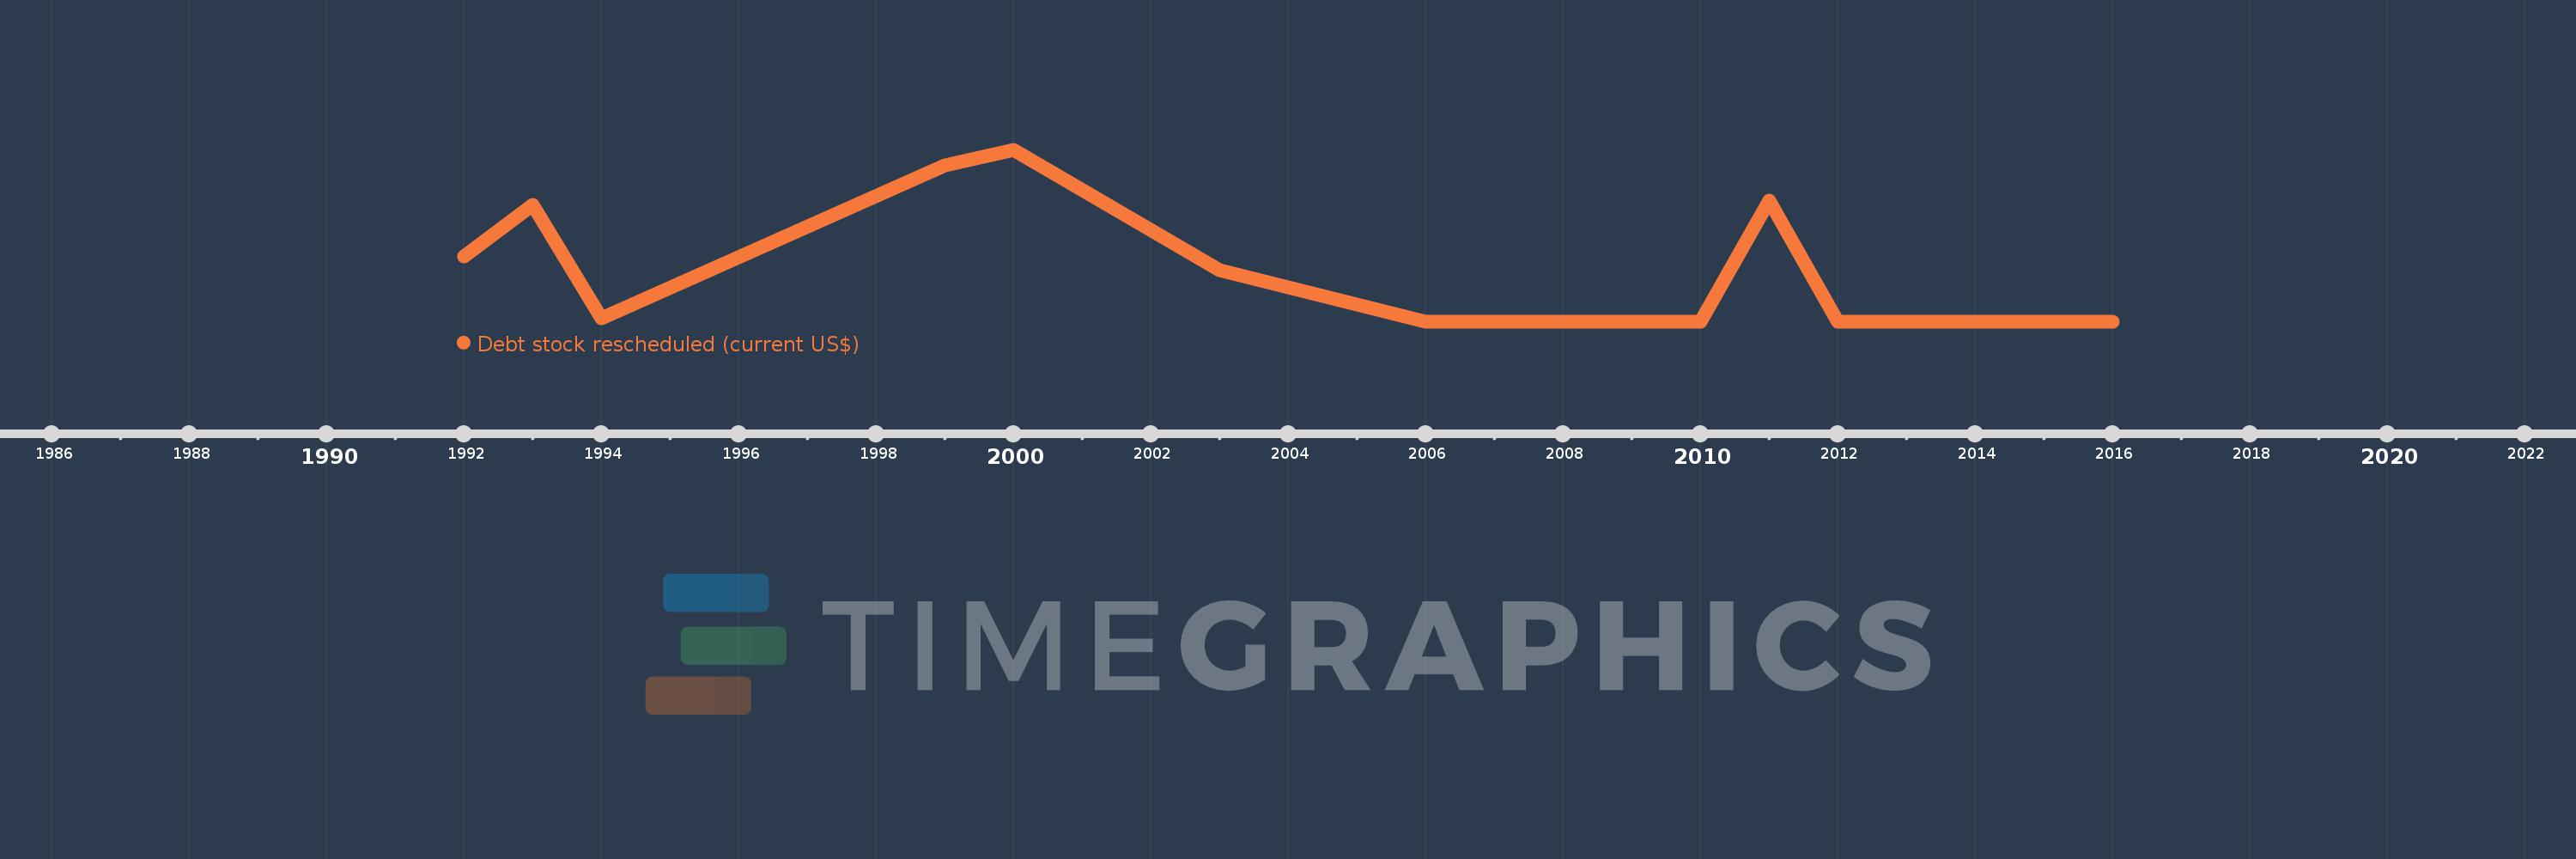
Questa scala temporale mostra un grafico dal 1992 anno al 2016 anno. East Asia & Pacific (excluding high income). I dati fino ad 1991 anno non disponibili. Il numero di osservazioni attuali secondo i date: 17.
La fonte (nome):
Indicatori dello sviluppo mondiale
La fonte (organizzazione):
World Bank, International Debt Statistics.
Categorie:
External Debt
sono stati aggiornati
23 apr 2017 anni
Indicatori delle variazioni dei valori per anni
In media:
778.212 Mln
Minima:
0.0
1 gen 2006 anni
Massimo:
3.3 Mlrd
1 gen 2000 anni
Alla data di osservazione
Valore
Variazione assoluta
La variazione rispetto al valore precedente
1 gen 1992 anni
1.261 Mlrd
+1.261 Mlrd
0.0%
1 gen 1993 anni
2.255 Mlrd
+993.578 Mln
78.76%
1 gen 1994 anni
69.104 Mln
-2.186 Mlrd
-96.94%
1 gen 1999 anni
3.002 Mlrd
+2.933 Mlrd
4.24 Mille.%
1 gen 2000 anni
3.3 Mlrd
+297.567 Mln
9.91%
1 gen 2003 anni
1.002 Mlrd
-2.298 Mlrd
-69.63%
1 gen 2006 anni
0.0
-1.002 Mlrd
-100.0%
1 gen 2007 anni
0.0
0.0
%
1 gen 2008 anni
230.0 Mille.
+230.0 Mille.
%
1 gen 2009 anni
0.0
-230.0 Mille.
-100.0%
1 gen 2010 anni
0.0
0.0
%
1 gen 2011 anni
2.339 Mlrd
+2.339 Mlrd
%
1 gen 2012 anni
0.0
-2.339 Mlrd
-100.0%
1 gen 2013 anni
0.0
0.0
%
1 gen 2014 anni
0.0
0.0
%
1 gen 2015 anni
0.0
0.0
%
1 gen 2016 anni
0.0
0.0
%
Classificazione dei paesi secondo i statistiche attuali per anni
