29
/it/
it
AIzaSyAYiBZKx7MnpbEhh9jyipgxe19OcubqV5w
April 1, 2024
27714
East Asia & Pacific
EAS
false
2
1
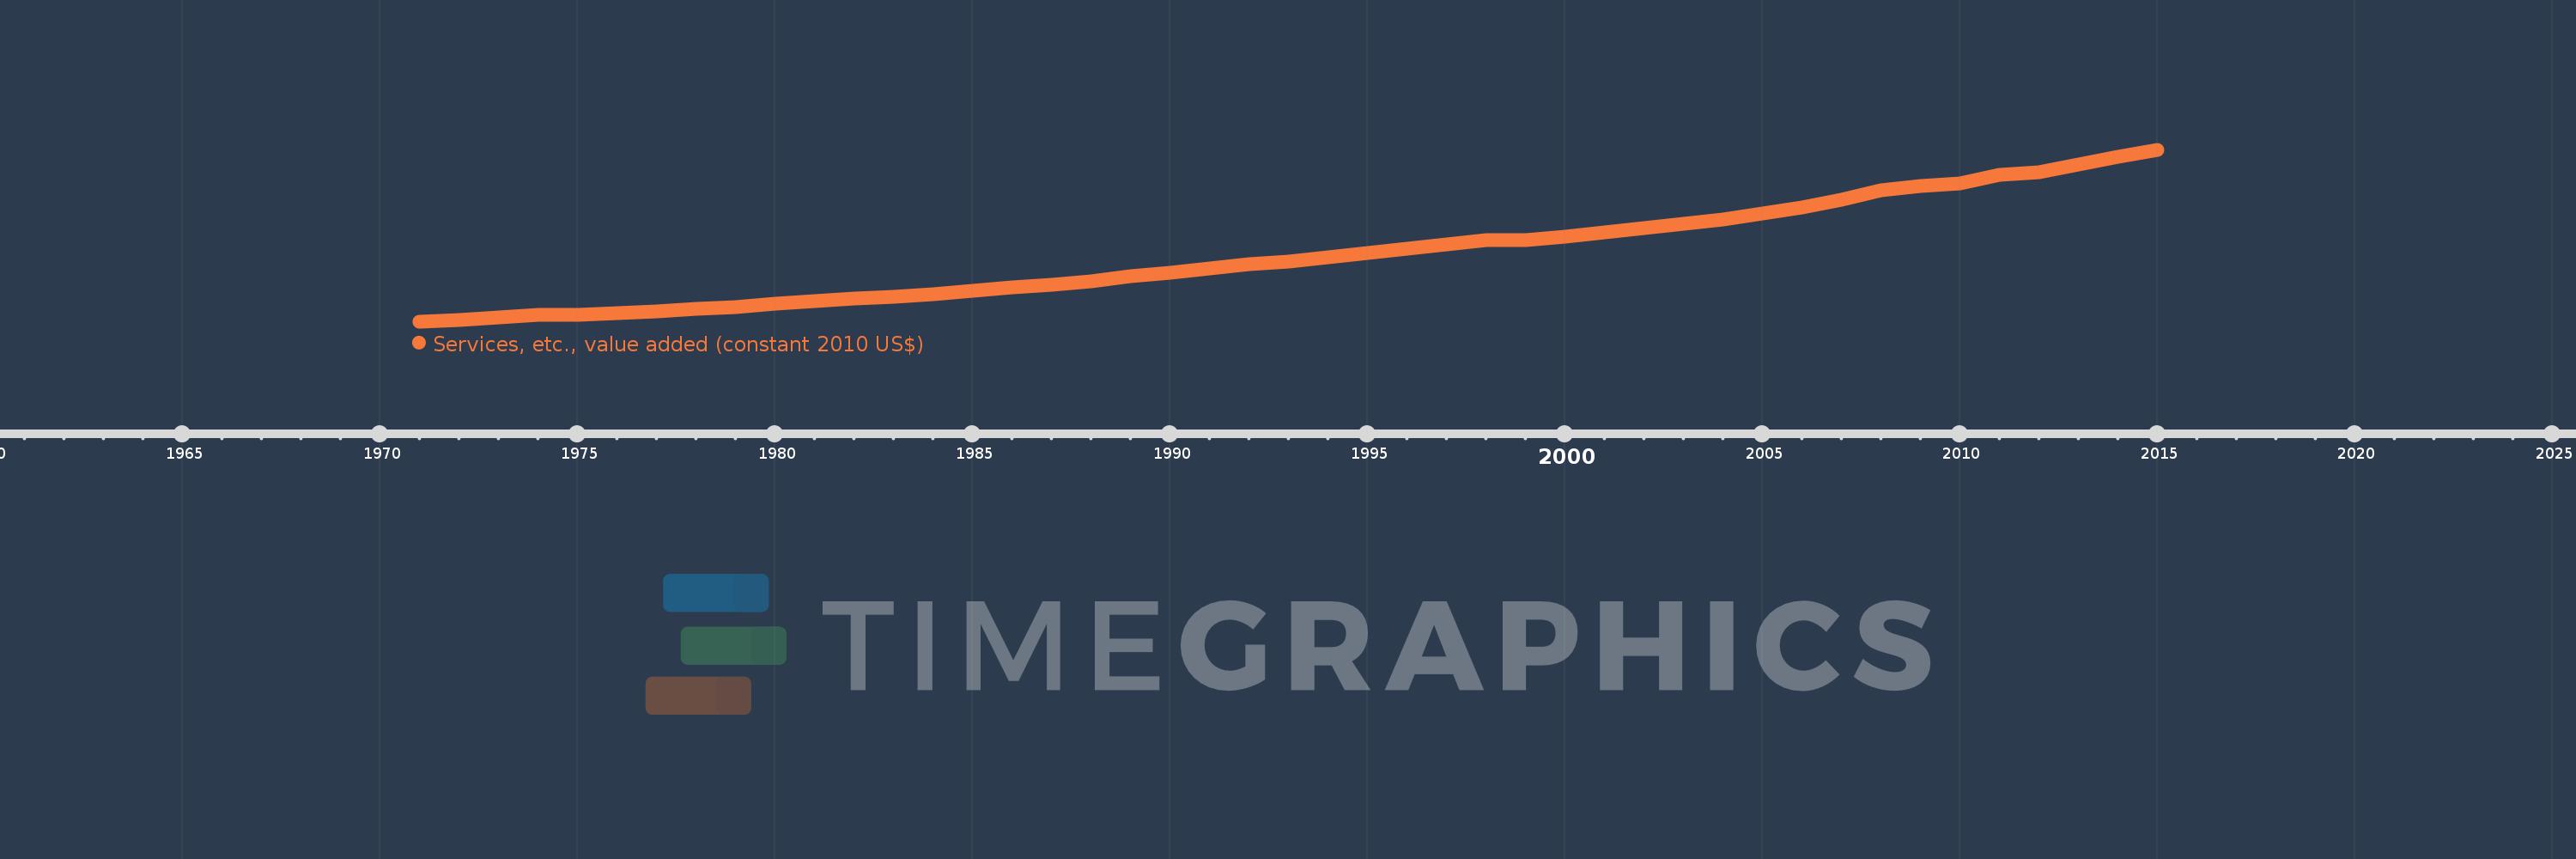
Services, etc., value added (constant 2010 US$)
2015,2014,2013,2012,2011,2010,2009,2008,2007,2006,2005,2004,2003,2002,2001,2000,1999,1998,1997,1996,1995,1994,1993,1992,1991,1990,1989,1988,1987,1986,1985,1984,1983,1982,1981,1980,1979,1978,1977,1976,1975,1974,1973,1972,1971
Queste statistiche in altri paesi:
AfghanistanAlbaniaAlgeriaAndorraAntigua and BarbudaArab WorldArgentinaArmeniaArubaAustraliaAustriaAzerbaijanBahamas, TheBahrainBangladeshBarbadosBelarusBelgiumBelizeBeninBermudaBhutanBoliviaBosnia and HerzegovinaBotswanaBrazilBrunei DarussalamBulgariaBurkina FasoBurundiCabo VerdeCambodiaCameroonCanadaCaribbean small statesCentral African RepublicCentral Europe and the BalticsChadChileChinaColombiaComorosCongo, Dem. Rep.Congo, Rep.Costa RicaCote d'IvoireCroatiaCubaCyprusCzech RepublicDenmarkDominicaDominican RepublicEarly-demographic dividendEast Asia & PacificEast Asia & Pacific (excluding high income)East Asia & Pacific (IDA & IBRD countries)EcuadorEgypt, Arab Rep.El SalvadorEquatorial GuineaEstoniaEthiopiaEuro areaEurope & Central AsiaEurope & Central Asia (excluding high income)Europe & Central Asia (IDA & IBRD countries)European UnionFaroe IslandsFijiFinlandFragile and conflict affected situationsFranceGabonGambia, TheGeorgiaGermanyGhanaGreeceGrenadaGuatemalaGuineaGuinea-BissauGuyanaHeavily indebted poor countries (HIPC)High incomeHondurasHong Kong SAR, ChinaHungaryIBRD onlyIcelandIDA & IBRD totalIDA blendIDA onlyIDA totalIndiaIndonesiaIran, Islamic Rep.IraqIrelandItalyJamaicaJapanJordanKazakhstanKenyaKiribatiKorea, Rep.KosovoKuwaitKyrgyz RepublicLao PDRLate-demographic dividendLatin America & Caribbean Latin America & Caribbean (excluding high income)Latin America & the Caribbean (IDA & IBRD countries)LatviaLeast developed countries: UN classificationLebanonLesothoLiberiaLithuaniaLow & middle incomeLow incomeLower middle incomeLuxembourgMacao SAR, ChinaMacedonia, FYRMadagascarMalawiMalaysiaMaldivesMaliMaltaMarshall IslandsMauritaniaMauritiusMexicoMicronesia, Fed. Sts.Middle East & North AfricaMiddle East & North Africa (excluding high income)Middle East & North Africa (IDA & IBRD countries)Middle incomeMoldovaMongoliaMontenegroMoroccoMozambiqueMyanmarNamibiaNepalNetherlandsNew ZealandNicaraguaNigerNigeriaNorth AmericaNorwayOECD membersOmanOther small statesPacific island small statesPakistanPalauPanamaParaguayPeruPhilippinesPolandPortugalPost-demographic dividendPre-demographic dividendPuerto RicoQatarRomaniaRussian FederationRwandaSamoaSao Tome and PrincipeSaudi ArabiaSenegalSerbiaSeychellesSierra LeoneSingaporeSlovak RepublicSloveniaSmall statesSouth AfricaSouth AsiaSouth Asia (IDA & IBRD)SpainSri LankaSt. Kitts and NevisSt. LuciaSt. Vincent and the GrenadinesSub-Saharan Africa Sub-Saharan Africa (excluding high income)Sub-Saharan Africa (IDA & IBRD countries)SudanSurinameSwazilandSwedenSwitzerlandTajikistanTanzaniaThailandTimor-LesteTogoTongaTrinidad and TobagoTunisiaTurkeyTurkmenistanTuvaluUgandaUkraineUnited Arab EmiratesUnited KingdomUnited StatesUpper middle incomeUruguayUzbekistanVanuatuVenezuela, RBVietnamWest Bank and GazaWorldYemen, Rep.ZambiaZimbabwe Linea del tempo:
Questa scala temporale mostra un grafico dal 1971 anno al 2015 anno. East Asia & Pacific. I dati fino ad 1970 anno non disponibili. Il numero di osservazioni attuali secondo i date: 45.
La fonte (nome):
Indicatori dello sviluppo mondiale
La fonte (organizzazione):
World Bank national accounts data, and OECD National Accounts data files.
Categorie:
Economy & Growth
sono stati aggiornati
23 apr 2017 anni
Indicatori delle variazioni dei valori per anni
Minima:
1.614 Trln
1 gen 1971 anni
Massimo:
10.845 Trln
1 gen 2015 anni
Alla data di osservazione
Valore
Variazione assoluta
La variazione rispetto al valore precedente
1 gen 1971 anni
1.614 Trln
+1.614 Trln
0.0%
1 gen 1972 anni
1.705 Trln
+90.81 Mlrd
5.63%
1 gen 1973 anni
1.86 Trln
+154.357 Mlrd
9.05%
1 gen 1974 anni
1.993 Trln
+133.27 Mlrd
7.17%
1 gen 1975 anni
2.01 Trln
+17.307 Mlrd
0.87%
1 gen 1976 anni
2.098 Trln
+87.98 Mlrd
4.38%
1 gen 1977 anni
2.181 Trln
+82.953 Mlrd
3.95%
1 gen 1978 anni
2.308 Trln
+127.089 Mlrd
5.83%
1 gen 1979 anni
2.428 Trln
+120.007 Mlrd
5.2%
1 gen 1980 anni
2.59 Trln
+162.181 Mlrd
6.68%
1 gen 1981 anni
2.739 Trln
+148.702 Mlrd
5.74%
1 gen 1982 anni
2.875 Trln
+135.974 Mlrd
4.96%
1 gen 1983 anni
2.985 Trln
+109.721 Mlrd
3.82%
1 gen 1984 anni
3.115 Trln
+130.445 Mlrd
4.37%
1 gen 1985 anni
3.274 Trln
+159.166 Mlrd
5.11%
1 gen 1986 anni
3.455 Trln
+180.621 Mlrd
5.52%
1 gen 1987 anni
3.614 Trln
+159.253 Mlrd
4.61%
1 gen 1988 anni
3.814 Trln
+199.656 Mlrd
5.52%
1 gen 1989 anni
4.063 Trln
+248.942 Mlrd
6.53%
1 gen 1990 anni
4.269 Trln
+206.524 Mlrd
5.08%
1 gen 1991 anni
4.472 Trln
+202.887 Mlrd
4.75%
1 gen 1992 anni
4.702 Trln
+230.167 Mlrd
5.15%
1 gen 1993 anni
4.873 Trln
+170.576 Mlrd
3.63%
1 gen 1994 anni
5.077 Trln
+203.823 Mlrd
4.18%
1 gen 1995 anni
5.336 Trln
+259.036 Mlrd
5.1%
1 gen 1996 anni
5.567 Trln
+230.778 Mlrd
4.33%
1 gen 1997 anni
5.797 Trln
+230.914 Mlrd
4.15%
1 gen 1998 anni
6.014 Trln
+216.166 Mlrd
3.73%
1 gen 1999 anni
6.027 Trln
+13.037 Mlrd
0.22%
1 gen 2000 anni
6.198 Trln
+170.968 Mlrd
2.84%
1 gen 2001 anni
6.444 Trln
+246.634 Mlrd
3.98%
1 gen 2002 anni
6.649 Trln
+204.608 Mlrd
3.18%
1 gen 2003 anni
6.891 Trln
+242.052 Mlrd
3.64%
1 gen 2004 anni
7.126 Trln
+234.855 Mlrd
3.41%
1 gen 2005 anni
7.445 Trln
+319.481 Mlrd
4.48%
1 gen 2006 anni
7.787 Trln
+342.196 Mlrd
4.6%
1 gen 2007 anni
8.173 Trln
+385.463 Mlrd
4.95%
1 gen 2008 anni
8.676 Trln
+502.59 Mlrd
6.15%
1 gen 2009 anni
8.926 Trln
+250.351 Mlrd
2.89%
1 gen 2010 anni
9.049 Trln
+122.953 Mlrd
1.38%
1 gen 2011 anni
9.5 Trln
+451.035 Mlrd
4.98%
1 gen 2012 anni
9.652 Trln
+152.373 Mlrd
1.6%
1 gen 2013 anni
10.077 Trln
+424.459 Mlrd
4.4%
1 gen 2014 anni
10.492 Trln
+415.32 Mlrd
4.12%
1 gen 2015 anni
10.845 Trln
+353.259 Mlrd
3.37%
Classificazione dei paesi secondo i statistiche attuali per anni


Commenti: