29
/it/
it
AIzaSyAYiBZKx7MnpbEhh9jyipgxe19OcubqV5w
April 1, 2024
276148
United Kingdom
GBR
true
2
1
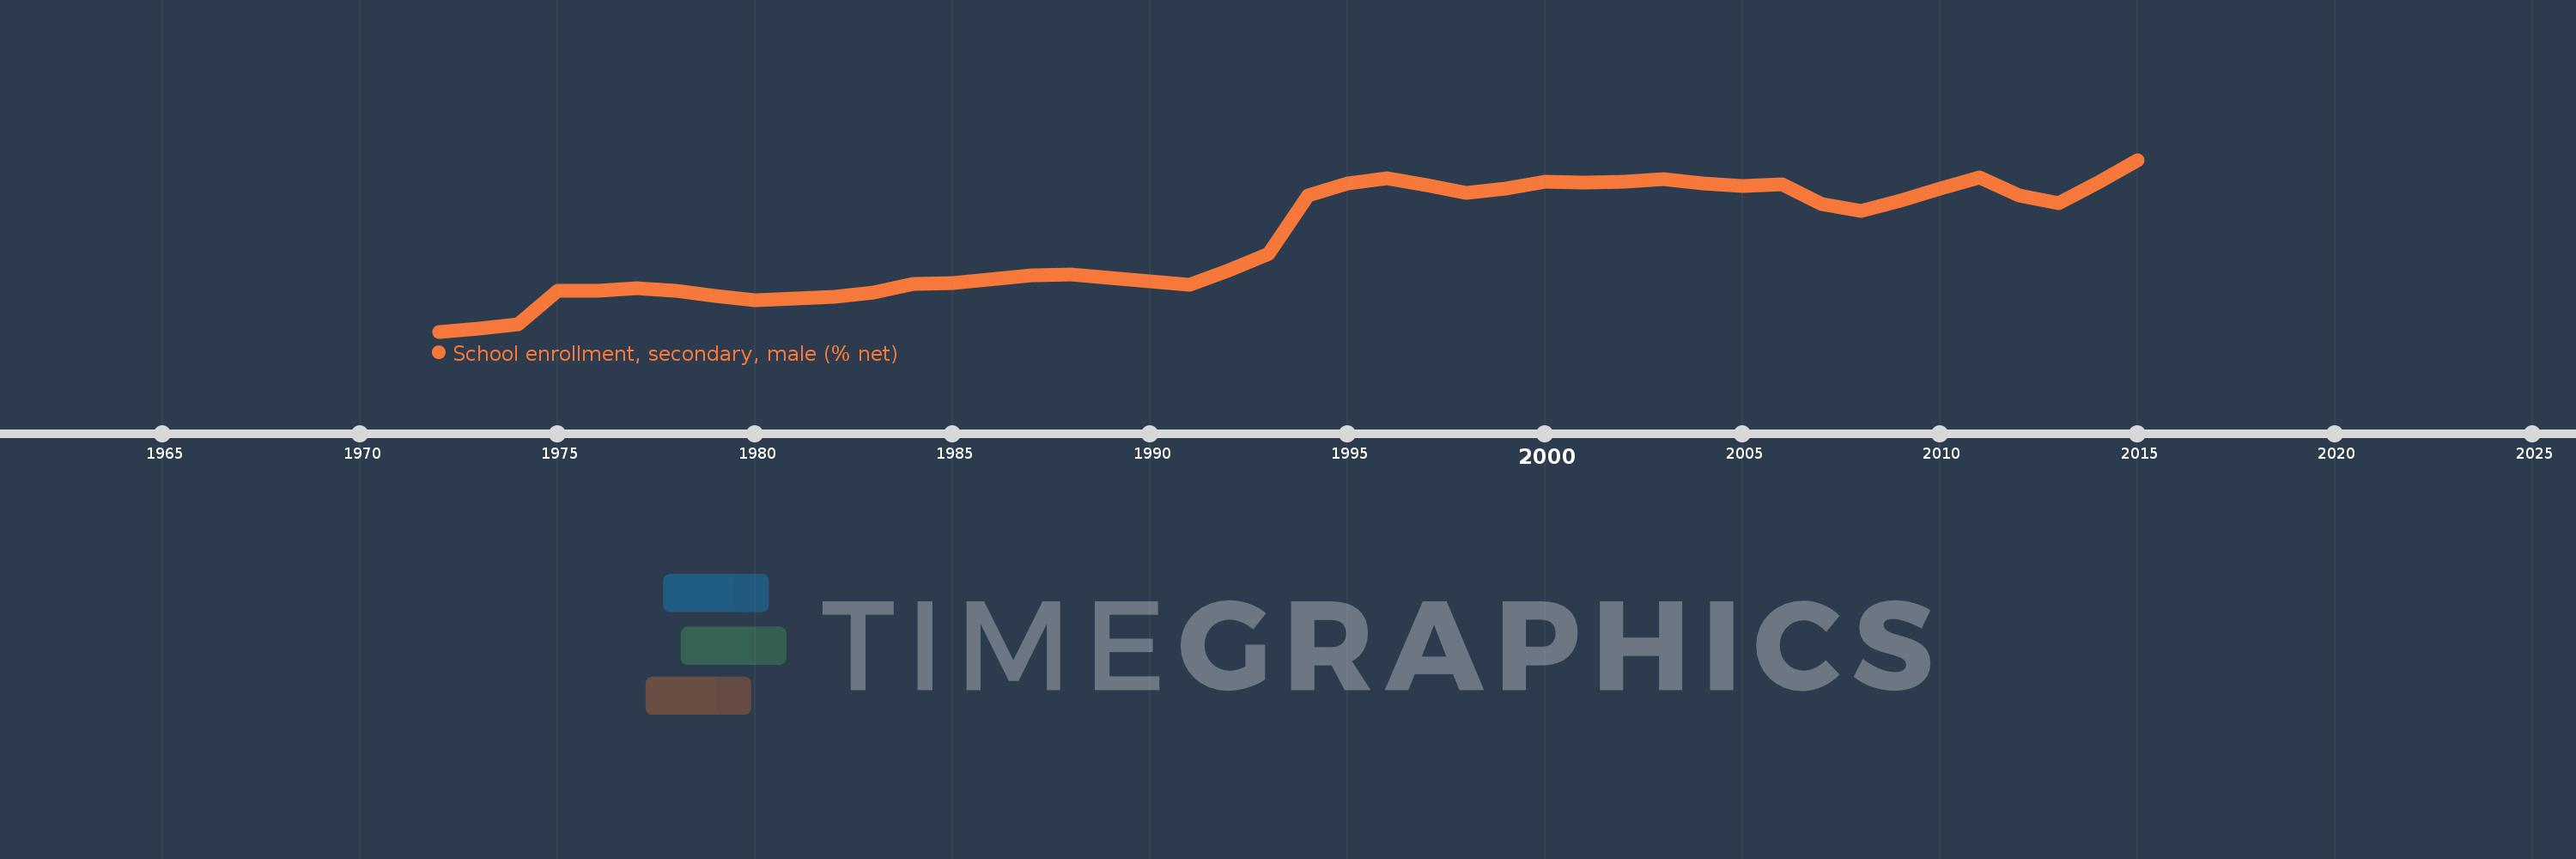
School enrollment, secondary, male (% net)
2015,2014,2013,2012,2011,2010,2009,2008,2007,2006,2005,2004,2003,2002,2001,2000,1999,1998,1997,1996,1995,1994,1993,1992,1991,1988,1987,1985,1984,1983,1982,1980,1979,1978,1977,1976,1975,1974,1973,1972
Queste statistiche in altri paesi:
AfghanistanAlbaniaAlgeriaAngolaAntigua and BarbudaArab WorldArgentinaArmeniaArubaAustraliaAzerbaijanBahamas, TheBahrainBangladeshBarbadosBelarusBelgiumBelizeBeninBermudaBhutanBoliviaBotswanaBrazilBrunei DarussalamBulgariaBurkina FasoBurundiCabo VerdeCambodiaCameroonCanadaCaribbean small statesCentral African RepublicCentral Europe and the BalticsChadChileColombiaComorosCongo, Dem. Rep.Congo, Rep.Costa RicaCroatiaCubaCyprusDenmarkDjiboutiDominicaDominican RepublicEarly-demographic dividendEast Asia & PacificEast Asia & Pacific (excluding high income)East Asia & Pacific (IDA & IBRD countries)EcuadorEgypt, Arab Rep.El SalvadorEquatorial GuineaEritreaEstoniaEthiopiaEuro areaEurope & Central AsiaEurope & Central Asia (excluding high income)Europe & Central Asia (IDA & IBRD countries)European UnionFijiFinlandFragile and conflict affected situationsFranceGambia, TheGeorgiaGhanaGreeceGrenadaGuatemalaGuineaGuinea-BissauGuyanaHeavily indebted poor countries (HIPC)High incomeHondurasHong Kong SAR, ChinaHungaryIBRD onlyIcelandIDA & IBRD totalIDA blendIDA onlyIDA totalIndiaIndonesiaIran, Islamic Rep.IraqIrelandIsraelItalyJamaicaJapanJordanKazakhstanKenyaKiribatiKorea, Rep.KuwaitKyrgyz RepublicLao PDRLate-demographic dividendLatin America & Caribbean Latin America & Caribbean (excluding high income)Latin America & the Caribbean (IDA & IBRD countries)LatviaLeast developed countries: UN classificationLebanonLesothoLibyaLiechtensteinLithuaniaLow & middle incomeLow incomeLower middle incomeLuxembourgMacao SAR, ChinaMacedonia, FYRMadagascarMalawiMaldivesMaliMaltaMarshall IslandsMauritaniaMauritiusMexicoMiddle East & North AfricaMiddle East & North Africa (excluding high income)Middle East & North Africa (IDA & IBRD countries)Middle incomeMoldovaMongoliaMoroccoMozambiqueMyanmarNamibiaNauruNepalNetherlandsNew ZealandNicaraguaNigerNorth AmericaNorwayOECD membersOmanOther small statesPacific island small statesPakistanPanamaParaguayPeruPhilippinesPolandPortugalPost-demographic dividendPre-demographic dividendPuerto RicoQatarRomaniaSamoaSao Tome and PrincipeSaudi ArabiaSenegalSerbiaSeychellesSierra LeoneSloveniaSmall statesSolomon IslandsSomaliaSouth AfricaSouth AsiaSouth Asia (IDA & IBRD)SpainSri LankaSt. Kitts and NevisSt. LuciaSt. Vincent and the GrenadinesSub-Saharan Africa Sub-Saharan Africa (excluding high income)Sub-Saharan Africa (IDA & IBRD countries)SurinameSwazilandSwedenSwitzerlandSyrian Arab RepublicTajikistanThailandTimor-LesteTogoTongaTrinidad and TobagoTunisiaTurkeyTuvaluUgandaUkraineUnited Arab EmiratesUnited KingdomUnited StatesUpper middle incomeUruguayVanuatuVenezuela, RBWest Bank and GazaWorldYemen, Rep.Zimbabwe Linea del tempo:
Questa scala temporale mostra un grafico dal 1972 anno al 2015 anno. United Kingdom. I dati fino ad 1971 anno non disponibili. Il numero di osservazioni attuali secondo i date: 40.
La fonte (nome):
Indicatori dello sviluppo mondiale
La fonte (organizzazione):
United Nations Educational, Scientific, and Cultural Organization (UNESCO) Institute for Statistics.
Categorie:
Education, Gender
sono stati aggiornati
23 apr 2017 anni
Indicatori delle variazioni dei valori per anni
Minima:
69.718
1 gen 1972 anni
Massimo:
97.834
1 gen 2015 anni
Alla data di osservazione
Valore
Variazione assoluta
La variazione rispetto al valore precedente
1 gen 1972 anni
69.718
+69.718
0.0%
1 gen 1973 anni
70.204
+0.486
0.7%
1 gen 1974 anni
70.891
+0.686
0.98%
1 gen 1975 anni
76.36
+5.47
7.72%
1 gen 1976 anni
76.435
+0.074
0.1%
1 gen 1977 anni
76.834
+0.399
0.52%
1 gen 1978 anni
76.342
-0.493
-0.64%
1 gen 1979 anni
75.557
-0.785
-1.03%
1 gen 1980 anni
74.914
-0.643
-0.85%
1 gen 1982 anni
75.481
+0.567
0.76%
1 gen 1983 anni
76.181
+0.7
0.93%
1 gen 1984 anni
77.579
+1.398
1.83%
1 gen 1985 anni
77.677
+0.098
0.13%
1 gen 1987 anni
78.894
+1.217
1.57%
1 gen 1988 anni
79.082
+0.189
0.24%
1 gen 1991 anni
77.373
-1.709
-2.16%
1 gen 1992 anni
79.829
+2.456
3.17%
1 gen 1993 anni
82.466
+2.637
3.3%
1 gen 1994 anni
92.039
+9.573
11.61%
1 gen 1995 anni
93.967
+1.928
2.09%
1 gen 1996 anni
94.79
+0.824
0.88%
1 gen 1997 anni
93.684
-1.106
-1.17%
1 gen 1998 anni
92.433
-1.251
-1.34%
1 gen 1999 anni
93.077
+0.644
0.7%
1 gen 2000 anni
94.185
+1.107
1.19%
1 gen 2001 anni
94.04
-0.144
-0.15%
1 gen 2002 anni
94.295
+0.255
0.27%
1 gen 2003 anni
94.736
+0.441
0.47%
1 gen 2004 anni
93.932
-0.804
-0.85%
1 gen 2005 anni
93.49
-0.443
-0.47%
1 gen 2006 anni
93.773
+0.283
0.3%
1 gen 2007 anni
90.663
-3.109
-3.32%
1 gen 2008 anni
89.529
-1.135
-1.25%
1 gen 2009 anni
91.183
+1.654
1.85%
1 gen 2010 anni
93.12
+1.937
2.12%
1 gen 2011 anni
94.979
+1.859
2.0%
1 gen 2012 anni
91.964
-3.014
-3.17%
1 gen 2013 anni
90.738
-1.226
-1.33%
1 gen 2014 anni
94.068
+3.33
3.67%
1 gen 2015 anni
97.834
+3.767
4.0%
Classificazione dei paesi secondo i statistiche attuali per anni


Commenti: