29
/it/
it
AIzaSyAYiBZKx7MnpbEhh9jyipgxe19OcubqV5w
April 1, 2024
27597
East Asia & Pacific
EAS
false
2
1
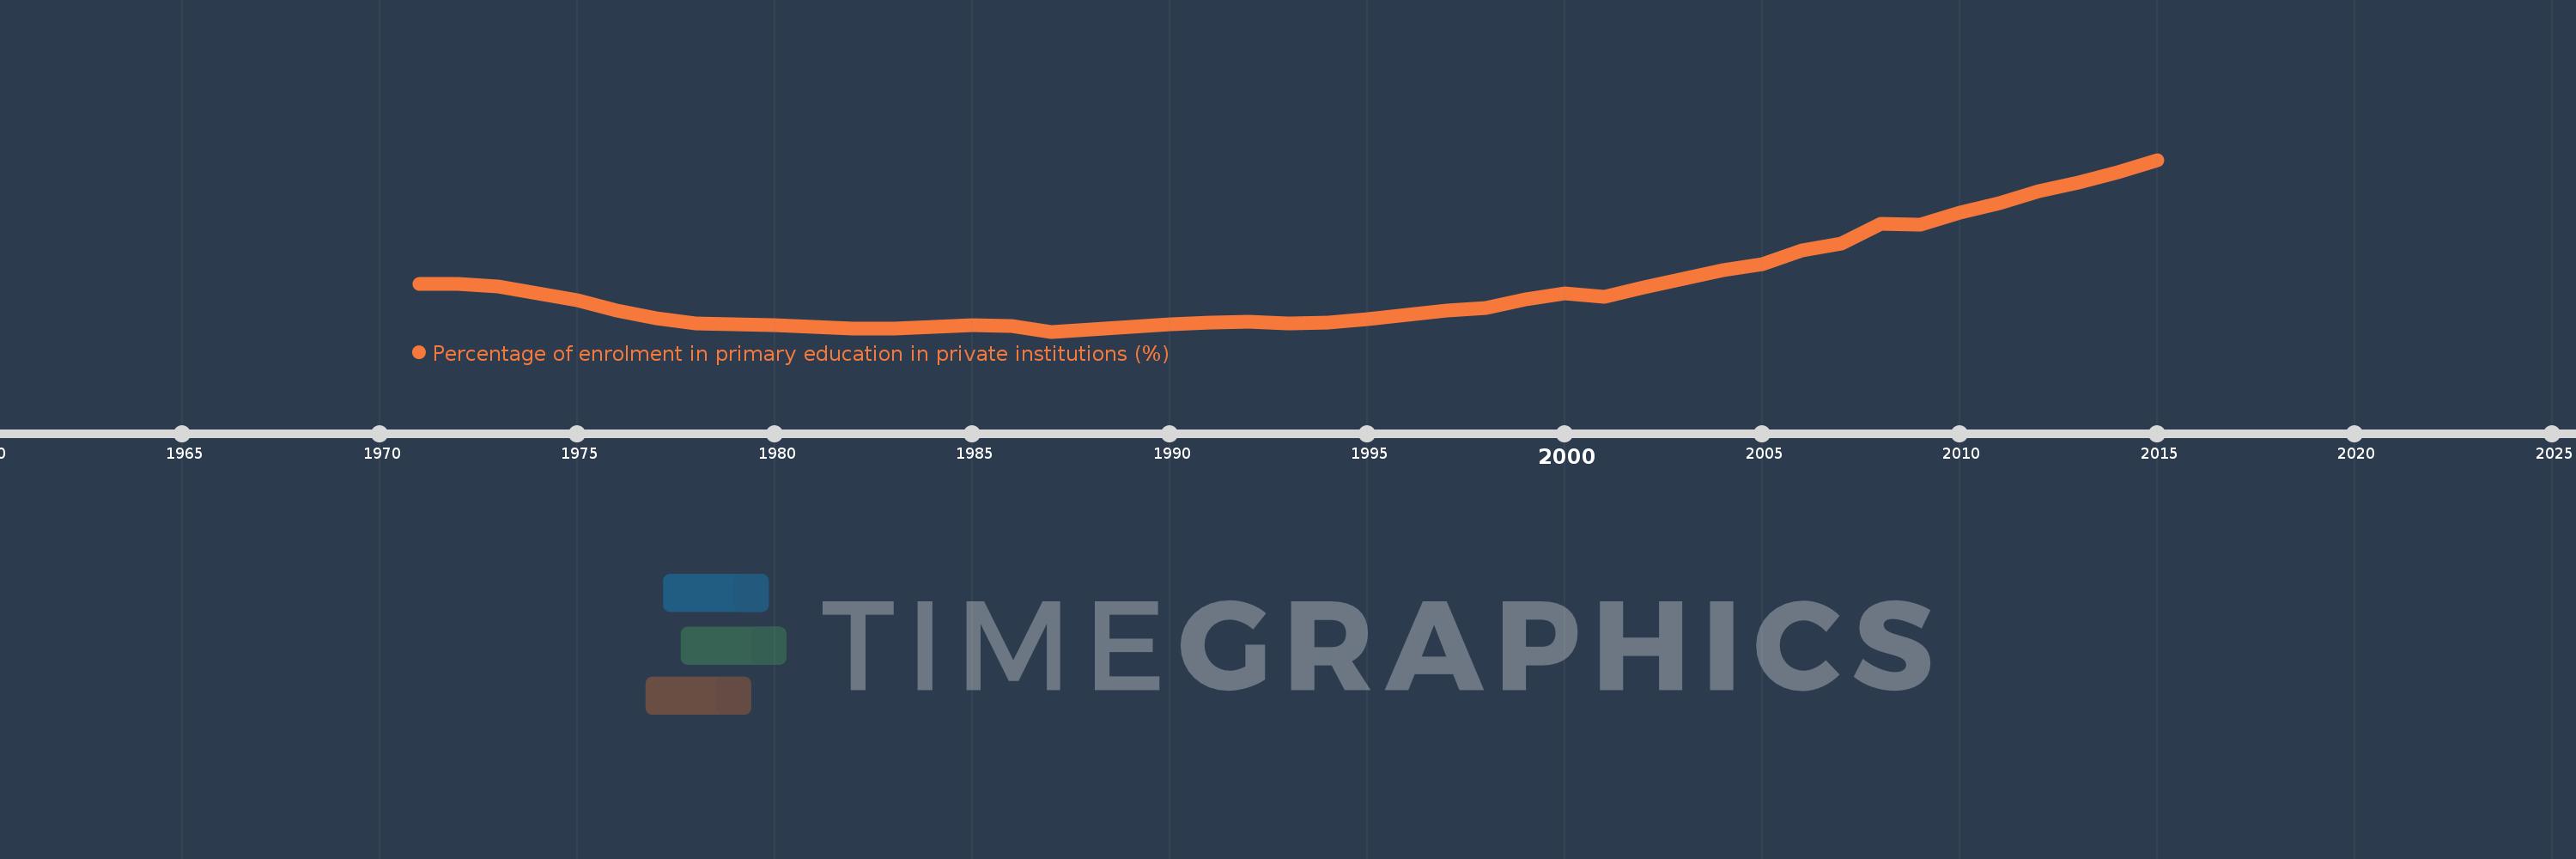
Percentage of enrolment in primary education in private institutions (%)
2015,2014,2013,2012,2011,2010,2009,2008,2007,2006,2005,2004,2003,2002,2001,2000,1999,1998,1997,1996,1995,1994,1993,1992,1991,1990,1989,1988,1987,1986,1985,1984,1983,1982,1981,1980,1979,1978,1977,1976,1975,1974,1973,1972,1971
Queste statistiche in altri paesi:
AfghanistanAlbaniaAlgeriaAndorraAngolaAntigua and BarbudaArab WorldArgentinaArmeniaArubaAustraliaAustriaAzerbaijanBahamas, TheBahrainBangladeshBarbadosBelarusBelgiumBelizeBeninBermudaBhutanBoliviaBosnia and HerzegovinaBotswanaBrazilBritish Virgin IslandsBrunei DarussalamBulgariaBurkina FasoBurundiCabo VerdeCambodiaCameroonCanadaCaribbean small statesCayman IslandsCentral African RepublicCentral Europe and the BalticsChadChileChinaColombiaComorosCongo, Dem. Rep.Congo, Rep.Costa RicaCote d'IvoireCroatiaCubaCuracaoCyprusCzech RepublicDenmarkDjiboutiDominicaDominican RepublicEarly-demographic dividendEast Asia & PacificEast Asia & Pacific (excluding high income)East Asia & Pacific (IDA & IBRD countries)EcuadorEgypt, Arab Rep.El SalvadorEquatorial GuineaEritreaEstoniaEthiopiaEuro areaEurope & Central AsiaEurope & Central Asia (excluding high income)Europe & Central Asia (IDA & IBRD countries)European UnionFijiFinlandFragile and conflict affected situationsFranceGabonGambia, TheGeorgiaGermanyGhanaGibraltarGreeceGrenadaGuatemalaGuineaGuinea-BissauGuyanaHaitiHeavily indebted poor countries (HIPC)High incomeHondurasHong Kong SAR, ChinaHungaryIBRD onlyIcelandIDA & IBRD totalIDA blendIDA onlyIDA totalIndiaIndonesiaIran, Islamic Rep.IraqIrelandIsraelItalyJamaicaJapanJordanKazakhstanKenyaKiribatiKorea, Rep.KuwaitKyrgyz RepublicLao PDRLate-demographic dividendLatin America & Caribbean Latin America & Caribbean (excluding high income)Latin America & the Caribbean (IDA & IBRD countries)LatviaLeast developed countries: UN classificationLebanonLesothoLiberiaLibyaLiechtensteinLithuaniaLow & middle incomeLow incomeLower middle incomeLuxembourgMacao SAR, ChinaMacedonia, FYRMadagascarMalawiMalaysiaMaldivesMaliMaltaMarshall IslandsMauritaniaMauritiusMexicoMiddle East & North AfricaMiddle East & North Africa (excluding high income)Middle East & North Africa (IDA & IBRD countries)Middle incomeMoldovaMonacoMongoliaMoroccoMozambiqueMyanmarNamibiaNauruNepalNetherlandsNew ZealandNicaraguaNigerNigeriaNorth AmericaNorwayOECD membersOmanOther small statesPacific island small statesPakistanPalauPanamaPapua New GuineaParaguayPeruPhilippinesPolandPortugalPost-demographic dividendPre-demographic dividendPuerto RicoQatarRomaniaRussian FederationRwandaSamoaSan MarinoSao Tome and PrincipeSaudi ArabiaSenegalSerbiaSeychellesSierra LeoneSingaporeSlovak RepublicSloveniaSmall statesSolomon IslandsSomaliaSouth AfricaSouth AsiaSouth Asia (IDA & IBRD)SpainSri LankaSt. Kitts and NevisSt. LuciaSt. Vincent and the GrenadinesSub-Saharan Africa Sub-Saharan Africa (excluding high income)Sub-Saharan Africa (IDA & IBRD countries)SudanSurinameSwazilandSwedenSwitzerlandSyrian Arab RepublicTajikistanTanzaniaThailandTimor-LesteTogoTongaTrinidad and TobagoTunisiaTurkeyTurks and Caicos IslandsTuvaluUgandaUkraineUnited Arab EmiratesUnited KingdomUnited StatesUpper middle incomeUruguayVanuatuVenezuela, RBVietnamWest Bank and GazaWorldYemen, Rep.ZambiaZimbabwe Linea del tempo:
Questa scala temporale mostra un grafico dal 1971 anno al 2015 anno. East Asia & Pacific. I dati fino ad 1970 anno non disponibili. Il numero di osservazioni attuali secondo i date: 45.
La fonte (nome):
Indicatori dello sviluppo mondiale
La fonte (organizzazione):
UNESCO Institute for Statistics
Categorie:
Education
sono stati aggiornati
23 apr 2017 anni
Indicatori delle variazioni dei valori per anni
Minima:
3.306
1 gen 1987 anni
Massimo:
8.73
1 gen 2015 anni
Alla data di osservazione
Valore
Variazione assoluta
La variazione rispetto al valore precedente
1 gen 1971 anni
4.817
+4.817
0.0%
1 gen 1972 anni
4.807
-0.01
-0.22%
1 gen 1973 anni
4.742
-0.064
-1.34%
1 gen 1974 anni
4.503
-0.24
-5.06%
1 gen 1975 anni
4.303
-0.2
-4.44%
1 gen 1976 anni
3.975
-0.328
-7.62%
1 gen 1977 anni
3.713
-0.261
-6.57%
1 gen 1978 anni
3.555
-0.158
-4.26%
1 gen 1979 anni
3.538
-0.017
-0.49%
1 gen 1980 anni
3.502
-0.035
-1.0%
1 gen 1981 anni
3.448
-0.054
-1.55%
1 gen 1982 anni
3.404
-0.044
-1.26%
1 gen 1983 anni
3.411
+0.006
0.19%
1 gen 1984 anni
3.464
+0.053
1.56%
1 gen 1985 anni
3.496
+0.032
0.92%
1 gen 1986 anni
3.488
-0.008
-0.22%
1 gen 1987 anni
3.306
-0.183
-5.23%
1 gen 1988 anni
3.376
+0.071
2.14%
1 gen 1989 anni
3.453
+0.077
2.27%
1 gen 1990 anni
3.537
+0.083
2.42%
1 gen 1991 anni
3.584
+0.047
1.34%
1 gen 1992 anni
3.614
+0.03
0.84%
1 gen 1993 anni
3.552
-0.062
-1.71%
1 gen 1994 anni
3.586
+0.034
0.96%
1 gen 1995 anni
3.702
+0.116
3.22%
1 gen 1996 anni
3.838
+0.136
3.68%
1 gen 1997 anni
3.971
+0.133
3.47%
1 gen 1998 anni
4.06
+0.089
2.24%
1 gen 1999 anni
4.312
+0.252
6.2%
1 gen 2000 anni
4.506
+0.194
4.49%
1 gen 2001 anni
4.394
-0.113
-2.5%
1 gen 2002 anni
4.693
+0.299
6.82%
1 gen 2003 anni
4.961
+0.268
5.7%
1 gen 2004 anni
5.243
+0.283
5.7%
1 gen 2005 anni
5.428
+0.185
3.53%
1 gen 2006 anni
5.872
+0.444
8.18%
1 gen 2007 anni
6.077
+0.204
3.48%
1 gen 2008 anni
6.71
+0.633
10.42%
1 gen 2009 anni
6.694
-0.016
-0.24%
1 gen 2010 anni
7.055
+0.361
5.4%
1 gen 2011 anni
7.374
+0.319
4.52%
1 gen 2012 anni
7.732
+0.358
4.86%
1 gen 2013 anni
8.011
+0.279
3.61%
1 gen 2014 anni
8.336
+0.324
4.05%
1 gen 2015 anni
8.73
+0.394
4.73%
Classificazione dei paesi secondo i statistiche attuali per anni


Commenti: