29
/it/
it
AIzaSyAYiBZKx7MnpbEhh9jyipgxe19OcubqV5w
April 1, 2024
275611
United Kingdom
GBR
true
2
1
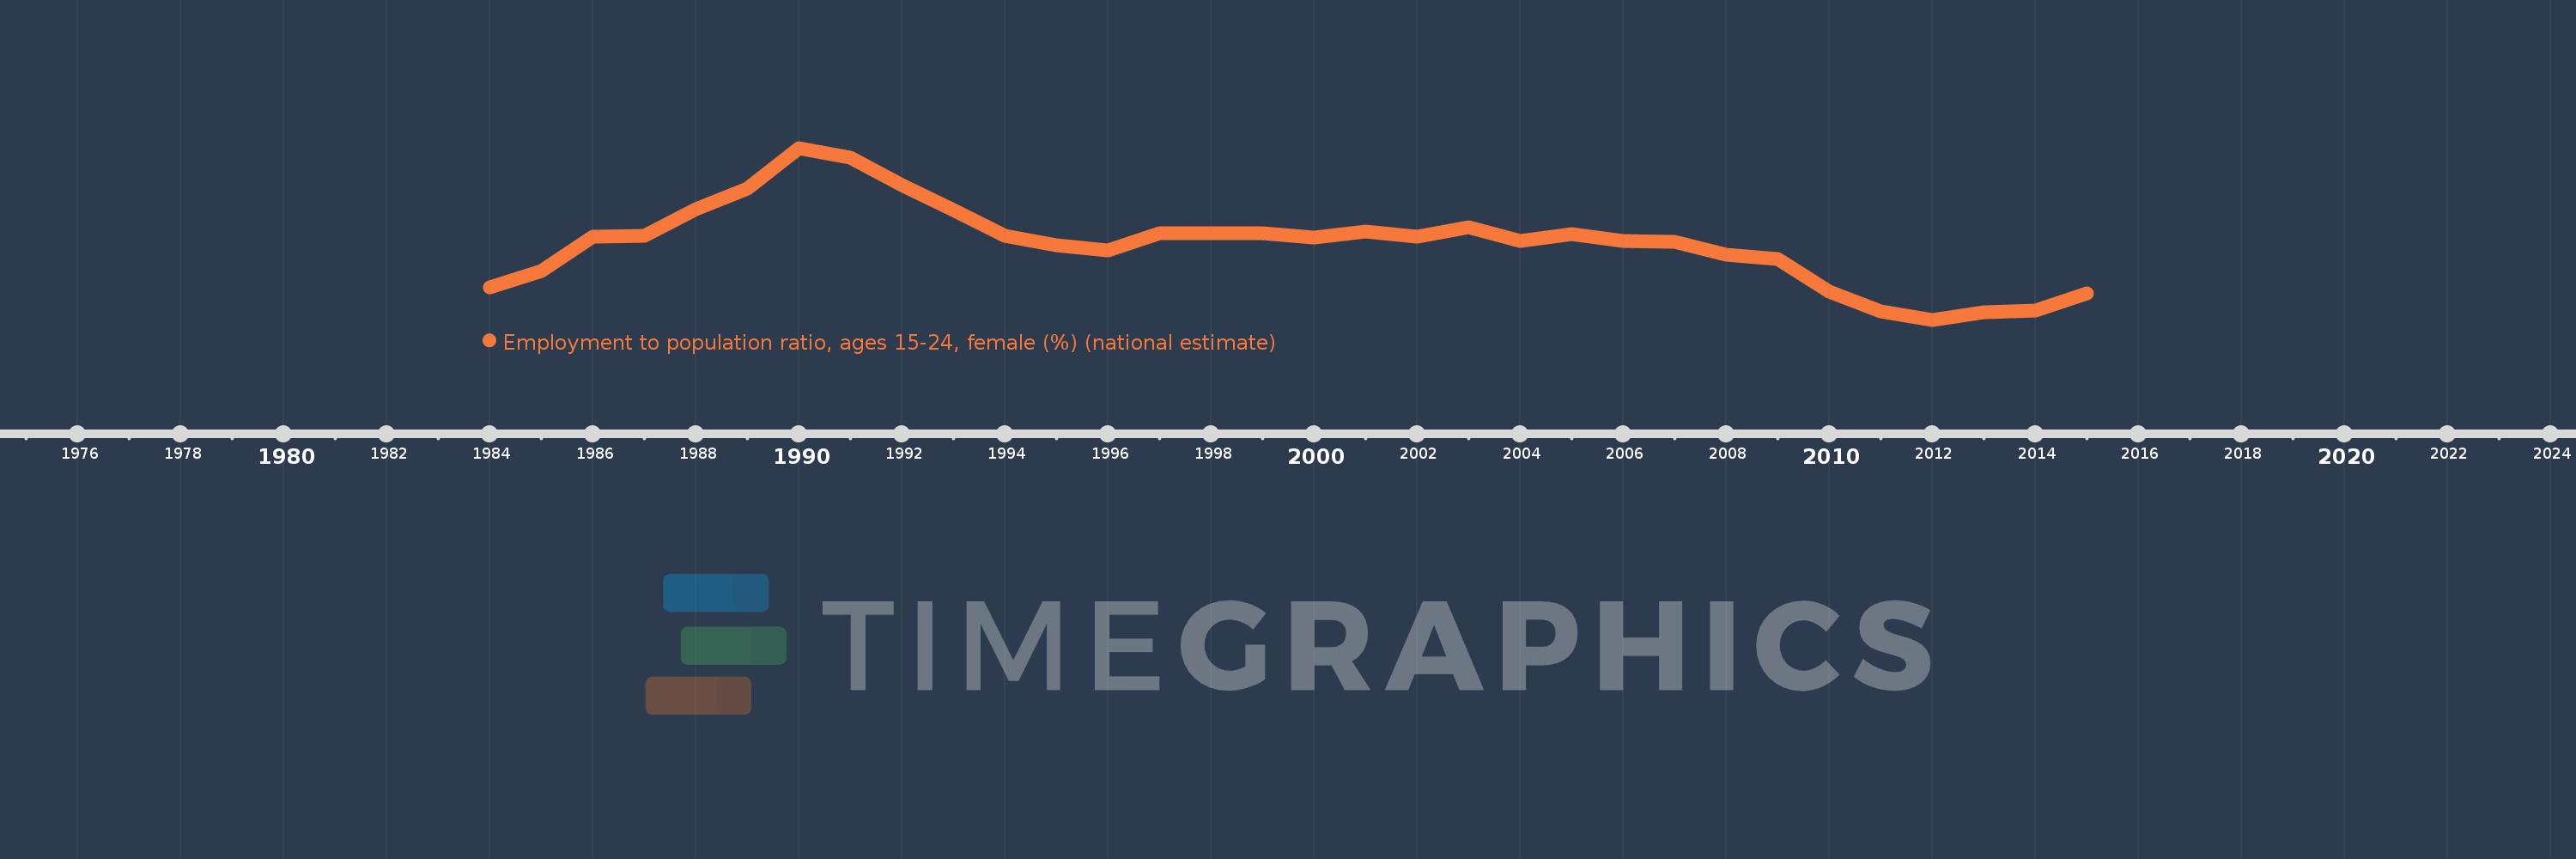
Employment to population ratio, ages 15-24, female (%) (national estimate)
2015,2014,2013,2012,2011,2010,2009,2008,2007,2006,2005,2004,2003,2002,2001,2000,1999,1998,1997,1996,1995,1994,1993,1992,1991,1990,1989,1988,1987,1986,1985,1984
Queste statistiche in altri paesi:
Linea del tempo:
Questa scala temporale mostra un grafico dal 1984 anno al 2015 anno. United Kingdom. I dati fino ad 1983 anno non disponibili. Il numero di osservazioni attuali secondo i date: 32.
La fonte (nome):
Indicatori dello sviluppo mondiale
La fonte (organizzazione):
International Labour Organization, Key Indicators of the Labour Market database.
Categorie:
Social Protection & Labor
sono stati aggiornati
23 apr 2017 anni
Indicatori delle variazioni dei valori per anni
Minima:
45.3
1 gen 2012 anni
Massimo:
61.4
1 gen 1990 anni
Alla data di osservazione
Valore
Variazione assoluta
La variazione rispetto al valore precedente
1 gen 1984 anni
48.3
+48.3
0.0%
1 gen 1985 anni
49.9
+1.6
3.31%
1 gen 1986 anni
53.1
+3.2
6.41%
1 gen 1987 anni
53.2
+0.1
0.19%
1 gen 1988 anni
55.7
+2.5
4.7%
1 gen 1989 anni
57.6
+1.9
3.41%
1 gen 1990 anni
61.4
+3.8
6.6%
1 gen 1991 anni
60.5
-0.9
-1.47%
1 gen 1992 anni
57.9
-2.6
-4.3%
1 gen 1993 anni
55.6
-2.3
-3.97%
1 gen 1994 anni
53.2
-2.4
-4.32%
1 gen 1995 anni
52.3
-0.9
-1.69%
1 gen 1996 anni
51.8
-0.5
-0.96%
1 gen 1997 anni
53.4
+1.6
3.09%
1 gen 1998 anni
53.4
0.0
0.0%
1 gen 1999 anni
53.4
0.0
0.0%
1 gen 2000 anni
53.0
-0.4
-0.75%
1 gen 2001 anni
53.6
+0.6
1.13%
1 gen 2002 anni
53.1
-0.5
-0.93%
1 gen 2003 anni
54.0
+0.9
1.69%
1 gen 2004 anni
52.7
-1.3
-2.41%
1 gen 2005 anni
53.3
+0.6
1.14%
1 gen 2006 anni
52.7
-0.6
-1.13%
1 gen 2007 anni
52.6
-0.1
-0.19%
1 gen 2008 anni
51.4
-1.2
-2.28%
1 gen 2009 anni
51.0
-0.4
-0.78%
1 gen 2010 anni
47.9
-3.1
-6.08%
1 gen 2011 anni
46.1
-1.8
-3.76%
1 gen 2012 anni
45.3
-0.8
-1.74%
1 gen 2013 anni
46.0
+0.7
1.55%
1 gen 2014 anni
46.2
+0.2
0.43%
1 gen 2015 anni
47.8
+1.6
3.46%
Classificazione dei paesi secondo i statistiche attuali per anni


Commenti: