29
/it/
it
AIzaSyAYiBZKx7MnpbEhh9jyipgxe19OcubqV5w
April 1, 2024
275406
United Kingdom
GBR
true
2
1
Agricultural land (sq. km)
2015,2014,2013,2012,2011,2010,2009,2008,2007,2006,2005,2004,2003,2002,2001,2000,1999,1998,1997,1996,1995,1994,1993,1992,1991,1990,1989,1988,1987,1986,1985,1984,1983,1982,1981,1980,1979,1978,1977,1976,1975,1974,1973,1972,1971,1970,1969,1968,1967,1966,1965,1964,1963,1962
Queste statistiche in altri paesi:
AfghanistanAlbaniaAlgeriaAmerican SamoaAndorraAngolaAntigua and BarbudaArab WorldArgentinaArmeniaArubaAustraliaAustriaAzerbaijanBahamas, TheBahrainBangladeshBarbadosBelarusBelgiumBelizeBeninBermudaBhutanBoliviaBosnia and HerzegovinaBotswanaBrazilBritish Virgin IslandsBrunei DarussalamBulgariaBurkina FasoBurundiCabo VerdeCambodiaCameroonCanadaCaribbean small statesCayman IslandsCentral African RepublicCentral Europe and the BalticsChadChannel IslandsChileChinaColombiaComorosCongo, Dem. Rep.Congo, Rep.Costa RicaCote d'IvoireCroatiaCubaCyprusCzech RepublicDenmarkDjiboutiDominicaDominican RepublicEarly-demographic dividendEast Asia & PacificEast Asia & Pacific (excluding high income)East Asia & Pacific (IDA & IBRD countries)EcuadorEgypt, Arab Rep.El SalvadorEquatorial GuineaEritreaEstoniaEthiopiaEuro areaEurope & Central AsiaEurope & Central Asia (excluding high income)Europe & Central Asia (IDA & IBRD countries)European UnionFaroe IslandsFijiFinlandFragile and conflict affected situationsFranceFrench PolynesiaGabonGambia, TheGeorgiaGermanyGhanaGreeceGreenlandGrenadaGuamGuatemalaGuineaGuinea-BissauGuyanaHaitiHeavily indebted poor countries (HIPC)High incomeHondurasHong Kong SAR, ChinaHungaryIBRD onlyIcelandIDA & IBRD totalIDA blendIDA onlyIDA totalIndiaIndonesiaIran, Islamic Rep.IraqIrelandIsle of ManIsraelItalyJamaicaJapanJordanKazakhstanKenyaKiribatiKorea, Dem. People’s Rep.Korea, Rep.KosovoKuwaitKyrgyz RepublicLao PDRLate-demographic dividendLatin America & Caribbean Latin America & Caribbean (excluding high income)Latin America & the Caribbean (IDA & IBRD countries)LatviaLeast developed countries: UN classificationLebanonLesothoLiberiaLibyaLiechtensteinLithuaniaLow & middle incomeLow incomeLower middle incomeLuxembourgMacedonia, FYRMadagascarMalawiMalaysiaMaldivesMaliMaltaMarshall IslandsMauritaniaMauritiusMexicoMicronesia, Fed. Sts.Middle East & North AfricaMiddle East & North Africa (excluding high income)Middle East & North Africa (IDA & IBRD countries)Middle incomeMoldovaMongoliaMontenegroMoroccoMozambiqueMyanmarNamibiaNauruNepalNetherlandsNew CaledoniaNew ZealandNicaraguaNigerNigeriaNorth AmericaNorthern Mariana IslandsNorwayOECD membersOmanOther small statesPacific island small statesPakistanPalauPanamaPapua New GuineaParaguayPeruPhilippinesPolandPortugalPost-demographic dividendPre-demographic dividendPuerto RicoQatarRomaniaRussian FederationRwandaSamoaSan MarinoSao Tome and PrincipeSaudi ArabiaSenegalSerbiaSeychellesSierra LeoneSingaporeSlovak RepublicSloveniaSmall statesSolomon IslandsSomaliaSouth AfricaSouth AsiaSouth Asia (IDA & IBRD)South SudanSpainSri LankaSt. Kitts and NevisSt. LuciaSt. Vincent and the GrenadinesSub-Saharan Africa Sub-Saharan Africa (excluding high income)Sub-Saharan Africa (IDA & IBRD countries)SudanSurinameSwazilandSwedenSwitzerlandSyrian Arab RepublicTajikistanTanzaniaThailandTimor-LesteTogoTongaTrinidad and TobagoTunisiaTurkeyTurkmenistanTurks and Caicos IslandsTuvaluUgandaUkraineUnited Arab EmiratesUnited KingdomUnited StatesUpper middle incomeUruguayUzbekistanVanuatuVenezuela, RBVietnamVirgin Islands (U.S.)West Bank and GazaWorldYemen, Rep.ZambiaZimbabwe Linea del tempo:
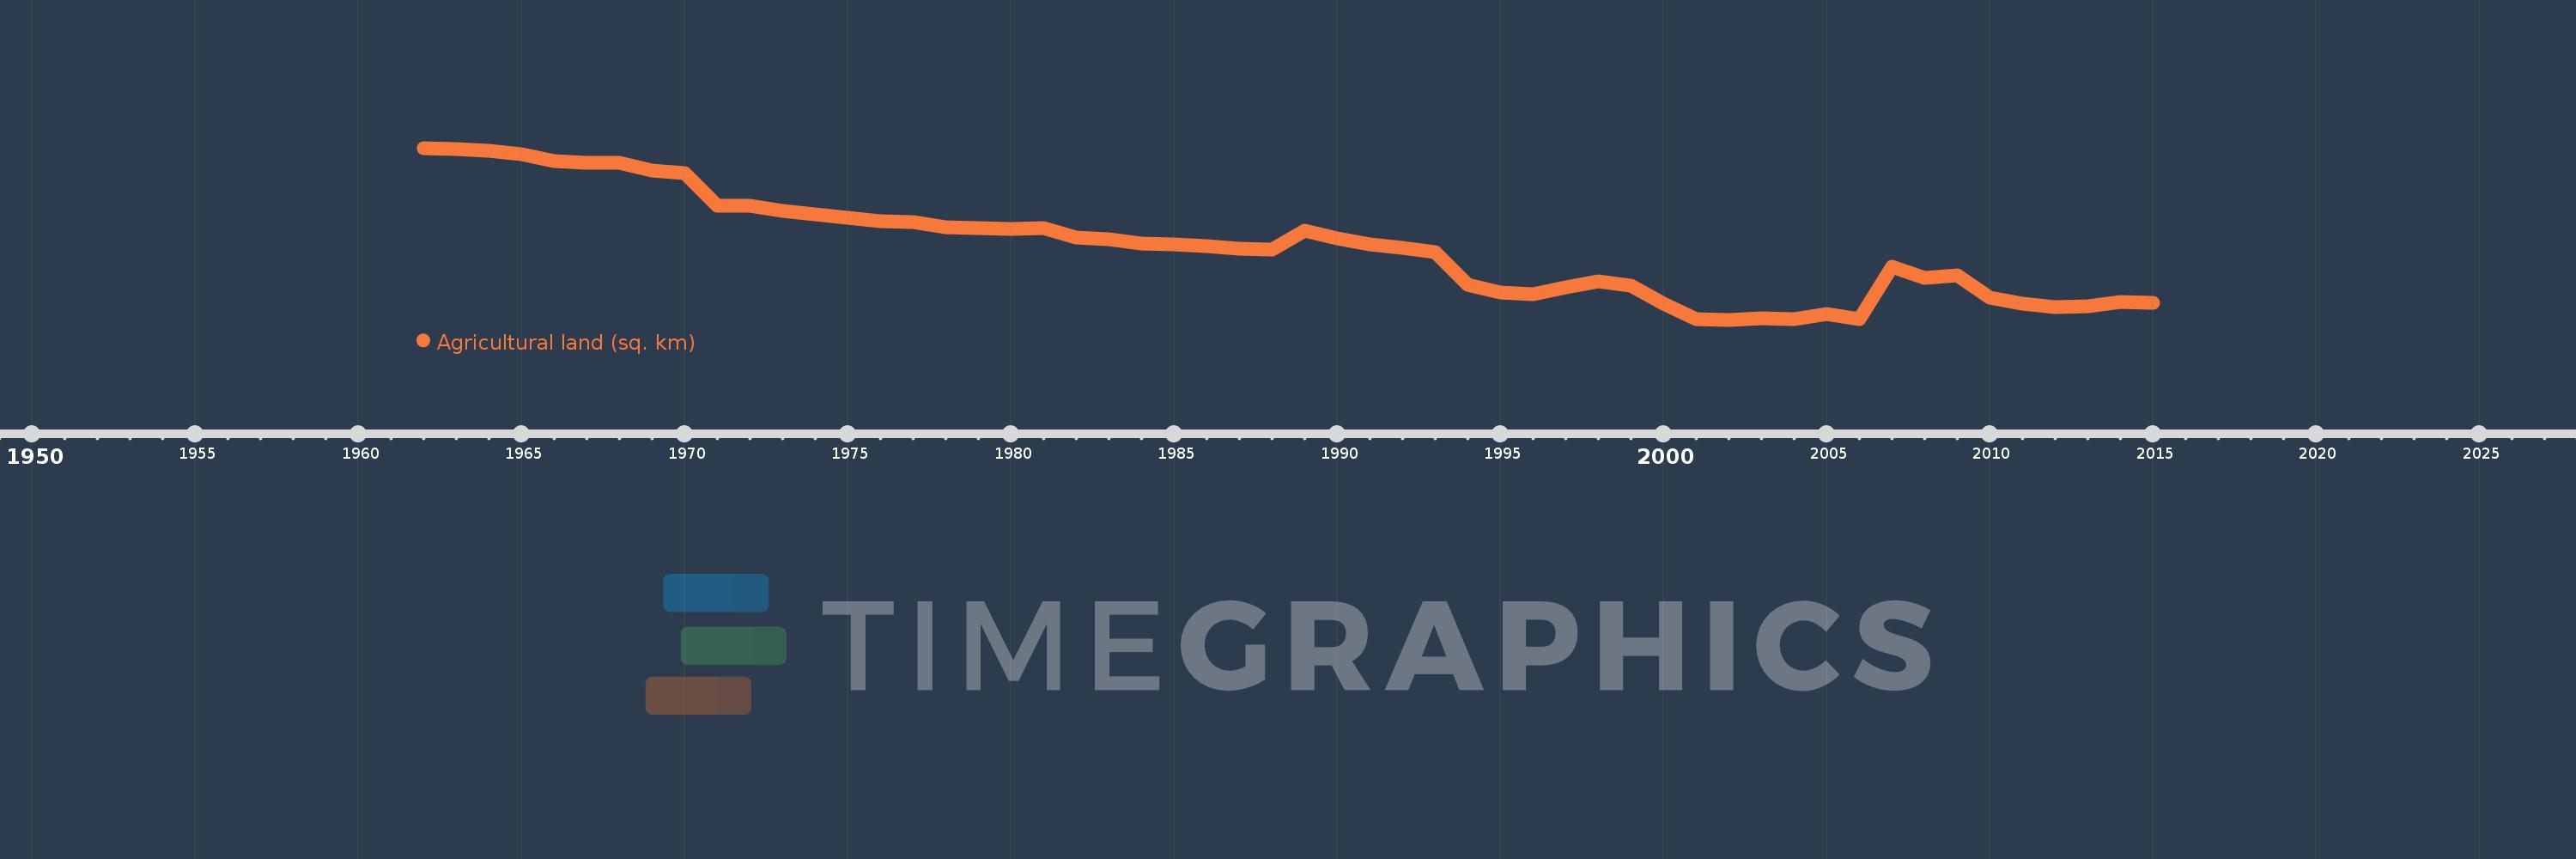
Questa scala temporale mostra un grafico dal 1962 anno al 2015 anno. United Kingdom. I dati fino ad 1961 anno non disponibili. Il numero di osservazioni attuali secondo i date: 54.
La fonte (nome):
Indicatori dello sviluppo mondiale
La fonte (organizzazione):
Food and Agriculture Organization, electronic files and web site.
Categorie:
Agriculture & Rural Development, Climate Change
sono stati aggiornati
23 apr 2017 anni
Indicatori delle variazioni dei valori per anni
Minima:
169.53 Mille.
1 gen 2002 anni
Massimo:
198.0 Mille.
1 gen 1962 anni
Alla data di osservazione
Valore
Variazione assoluta
La variazione rispetto al valore precedente
1 gen 1962 anni
198.0 Mille.
+198.0 Mille.
0.0%
1 gen 1963 anni
197.79 Mille.
-210.0
-0.11%
1 gen 1964 anni
197.47 Mille.
-320.0
-0.16%
1 gen 1965 anni
197.03 Mille.
-440.0
-0.22%
1 gen 1966 anni
195.85 Mille.
-1.18 Mille.
-0.6%
1 gen 1967 anni
195.5 Mille.
-350.0
-0.18%
1 gen 1968 anni
195.54 Mille.
+40.0
0.02%
1 gen 1969 anni
194.26 Mille.
-1.28 Mille.
-0.65%
1 gen 1970 anni
193.8 Mille.
-460.0
-0.24%
1 gen 1971 anni
188.49 Mille.
-5.31 Mille.
-2.74%
1 gen 1972 anni
188.43 Mille.
-60.0
-0.03%
1 gen 1973 anni
187.56 Mille.
-870.0
-0.46%
1 gen 1974 anni
186.96 Mille.
-600.0
-0.32%
1 gen 1975 anni
186.38 Mille.
-580.0
-0.31%
1 gen 1976 anni
185.83 Mille.
-550.0
-0.3%
1 gen 1977 anni
185.68 Mille.
-150.0
-0.08%
1 gen 1978 anni
184.9 Mille.
-780.0
-0.42%
1 gen 1979 anni
184.78 Mille.
-120.0
-0.06%
1 gen 1980 anni
184.52 Mille.
-260.0
-0.14%
1 gen 1981 anni
184.69 Mille.
+170.0
0.09%
1 gen 1982 anni
183.2 Mille.
-1.49 Mille.
-0.81%
1 gen 1983 anni
182.81 Mille.
-390.0
-0.21%
1 gen 1984 anni
182.16 Mille.
-650.0
-0.36%
1 gen 1985 anni
182.02 Mille.
-140.0
-0.08%
1 gen 1986 anni
181.68 Mille.
-340.0
-0.19%
1 gen 1987 anni
181.3 Mille.
-380.0
-0.21%
1 gen 1988 anni
181.16 Mille.
-140.0
-0.08%
1 gen 1989 anni
184.23 Mille.
+3.07 Mille.
1.69%
1 gen 1990 anni
183.06 Mille.
-1.17 Mille.
-0.64%
1 gen 1991 anni
182.03 Mille.
-1.03 Mille.
-0.56%
1 gen 1992 anni
181.43 Mille.
-600.0
-0.33%
1 gen 1993 anni
180.7 Mille.
-730.0
-0.4%
1 gen 1994 anni
175.34 Mille.
-5.36 Mille.
-2.97%
1 gen 1995 anni
174.09 Mille.
-1.25 Mille.
-0.71%
1 gen 1996 anni
173.79 Mille.
-300.0
-0.17%
1 gen 1997 anni
174.94 Mille.
+1.15 Mille.
0.66%
1 gen 1998 anni
175.85 Mille.
+910.0
0.52%
1 gen 1999 anni
175.18 Mille.
-670.0
-0.38%
1 gen 2000 anni
172.19 Mille.
-2.99 Mille.
-1.71%
1 gen 2001 anni
169.64 Mille.
-2.55 Mille.
-1.48%
1 gen 2002 anni
169.53 Mille.
-110.0
-0.06%
1 gen 2003 anni
169.76 Mille.
+230.0
0.14%
1 gen 2004 anni
169.56 Mille.
-200.0
-0.12%
1 gen 2005 anni
170.51 Mille.
+950.0
0.56%
1 gen 2006 anni
169.56 Mille.
-950.0
-0.56%
1 gen 2007 anni
178.38 Mille.
+8.82 Mille.
5.2%
1 gen 2008 anni
176.47 Mille.
-1.91 Mille.
-1.07%
1 gen 2009 anni
176.84 Mille.
+370.0
0.21%
1 gen 2010 anni
173.25 Mille.
-3.59 Mille.
-2.03%
1 gen 2011 anni
172.24 Mille.
-1.01 Mille.
-0.58%
1 gen 2012 anni
171.64 Mille.
-600.0
-0.35%
1 gen 2013 anni
171.82 Mille.
+180.0
0.1%
1 gen 2014 anni
172.502 Mille.
+682.0
0.4%
1 gen 2015 anni
172.32 Mille.
-182.0
-0.11%
Classificazione dei paesi secondo i statistiche attuali per anni


Commenti: