29
/it/
it
AIzaSyAYiBZKx7MnpbEhh9jyipgxe19OcubqV5w
April 1, 2024
273075
Uganda
UGA
true
2
1
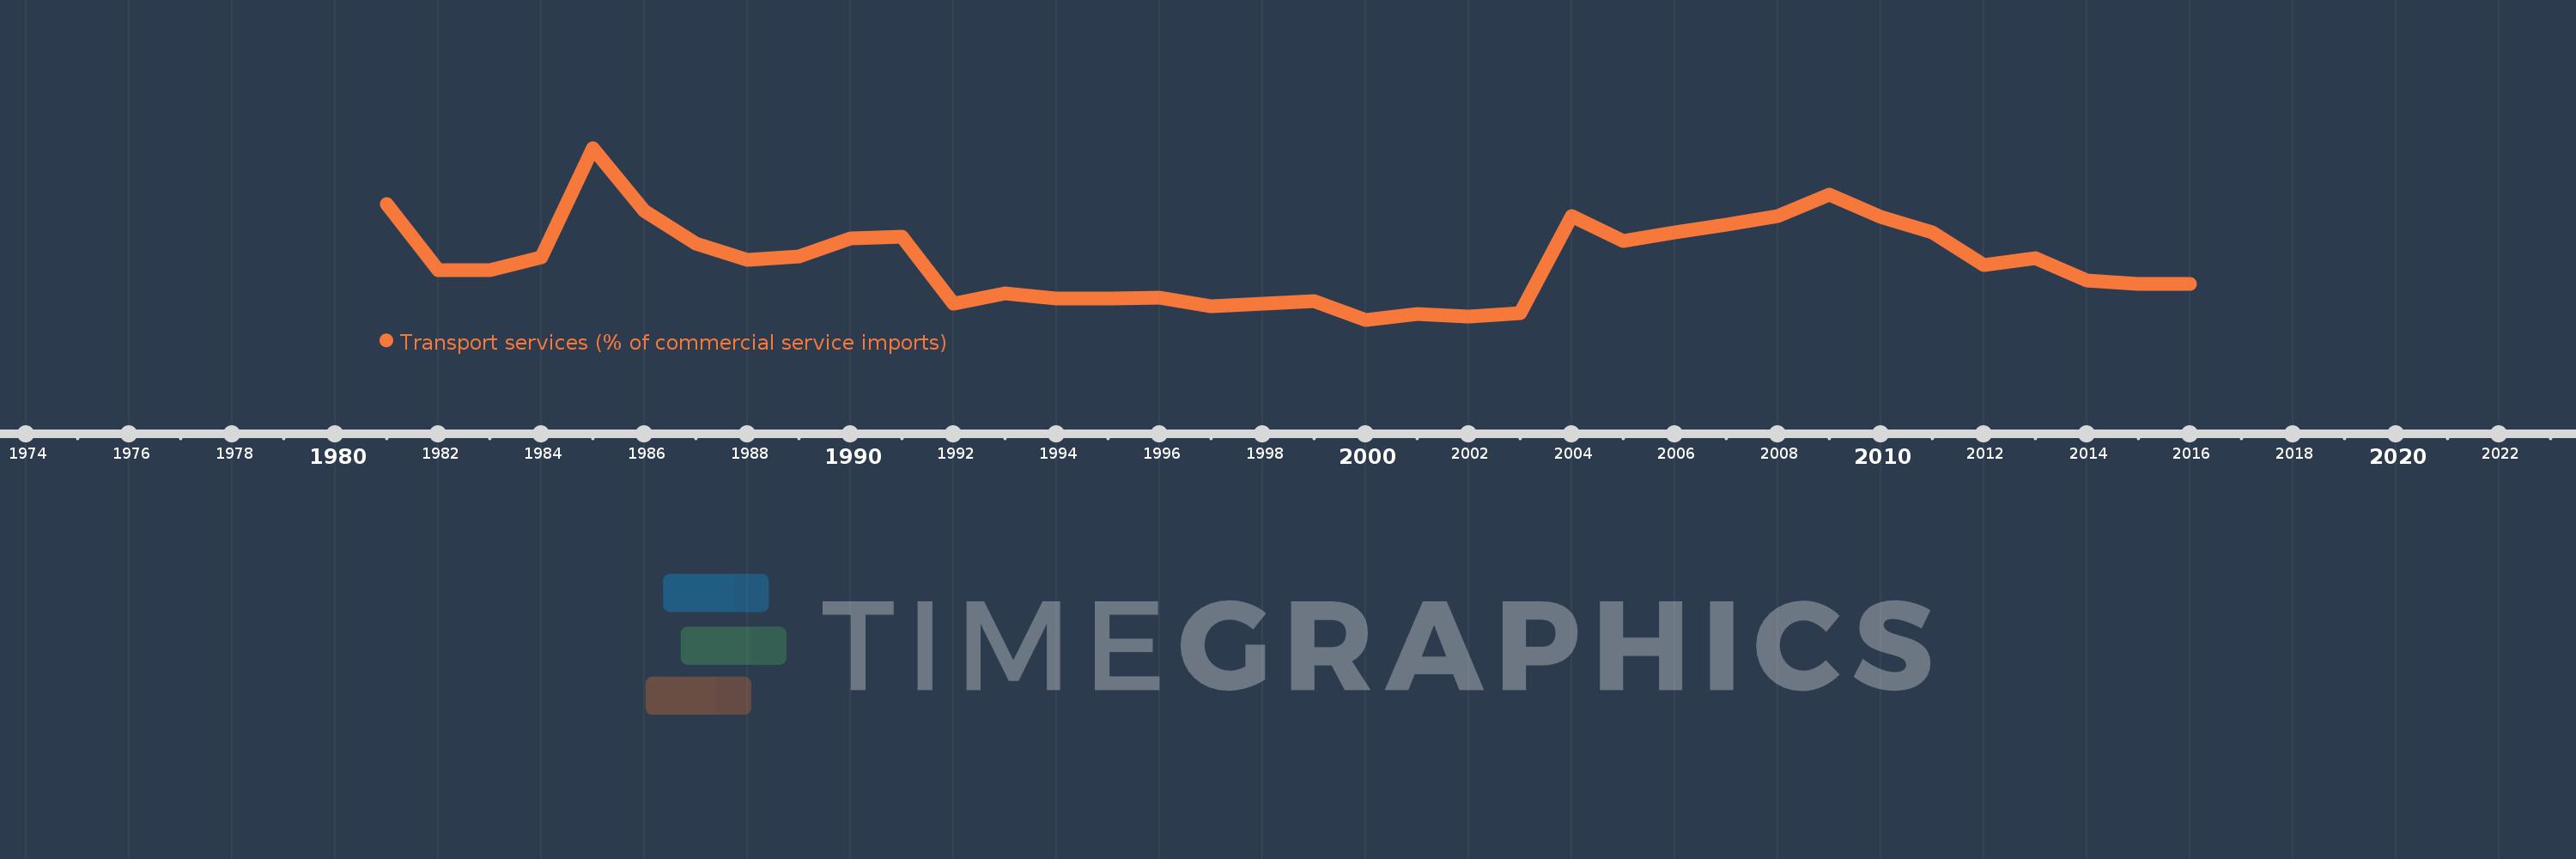
Transport services (% of commercial service imports)
2016,2015,2014,2013,2012,2011,2010,2009,2008,2007,2006,2005,2004,2003,2002,2001,2000,1999,1998,1997,1996,1995,1994,1993,1992,1991,1990,1989,1988,1987,1986,1985,1984,1983,1982,1981
Queste statistiche in altri paesi:
AfghanistanAlbaniaAlgeriaAngolaAntigua and BarbudaArab WorldArgentinaArmeniaArubaAustraliaAustriaAzerbaijanBahamas, TheBahrainBangladeshBarbadosBelarusBelgiumBelizeBeninBermudaBhutanBoliviaBosnia and HerzegovinaBotswanaBrazilBrunei DarussalamBulgariaBurkina FasoBurundiCabo VerdeCambodiaCameroonCanadaCaribbean small statesCentral African RepublicCentral Europe and the BalticsChadChileChinaColombiaComorosCongo, Dem. Rep.Congo, Rep.Costa RicaCote d'IvoireCroatiaCuracaoCyprusCzech RepublicDenmarkDjiboutiDominicaDominican RepublicEarly-demographic dividendEast Asia & PacificEast Asia & Pacific (excluding high income)East Asia & Pacific (IDA & IBRD countries)EcuadorEgypt, Arab Rep.El SalvadorEquatorial GuineaEritreaEstoniaEthiopiaEuro areaEurope & Central AsiaEurope & Central Asia (excluding high income)Europe & Central Asia (IDA & IBRD countries)European UnionFaroe IslandsFijiFinlandFragile and conflict affected situationsFranceFrench PolynesiaGabonGambia, TheGeorgiaGermanyGhanaGreeceGrenadaGuatemalaGuineaGuinea-BissauGuyanaHaitiHeavily indebted poor countries (HIPC)High incomeHondurasHong Kong SAR, ChinaHungaryIBRD onlyIcelandIDA & IBRD totalIDA onlyIDA totalIndiaIndonesiaIran, Islamic Rep.IraqIrelandIsraelItalyJamaicaJapanJordanKazakhstanKenyaKiribatiKorea, Rep.KosovoKuwaitKyrgyz RepublicLao PDRLate-demographic dividendLatin America & Caribbean Latin America & Caribbean (excluding high income)Latin America & the Caribbean (IDA & IBRD countries)LatviaLeast developed countries: UN classificationLebanonLesothoLiberiaLibyaLithuaniaLow & middle incomeLow incomeLower middle incomeLuxembourgMacao SAR, ChinaMacedonia, FYRMadagascarMalawiMalaysiaMaldivesMaliMaltaMarshall IslandsMauritaniaMauritiusMexicoMicronesia, Fed. Sts.Middle East & North AfricaMiddle East & North Africa (excluding high income)Middle East & North Africa (IDA & IBRD countries)Middle incomeMoldovaMongoliaMontenegroMoroccoMozambiqueMyanmarNamibiaNepalNetherlandsNew CaledoniaNew ZealandNicaraguaNigerNigeriaNorth AmericaNorwayOECD membersOmanOther small statesPacific island small statesPakistanPalauPanamaPapua New GuineaParaguayPeruPhilippinesPolandPortugalPost-demographic dividendPre-demographic dividendQatarRomaniaRussian FederationRwandaSamoaSao Tome and PrincipeSaudi ArabiaSenegalSerbiaSeychellesSierra LeoneSingaporeSint Maarten (Dutch part)Slovak RepublicSloveniaSmall statesSolomon IslandsSouth AfricaSouth AsiaSouth Asia (IDA & IBRD)South SudanSpainSri LankaSt. Kitts and NevisSt. LuciaSt. Vincent and the GrenadinesSub-Saharan Africa Sub-Saharan Africa (excluding high income)Sub-Saharan Africa (IDA & IBRD countries)SudanSurinameSwazilandSwedenSwitzerlandSyrian Arab RepublicTajikistanTanzaniaThailandTimor-LesteTogoTongaTrinidad and TobagoTunisiaTurkeyTuvaluUgandaUkraineUnited KingdomUnited StatesUpper middle incomeUruguayVanuatuVenezuela, RBWest Bank and GazaWorldYemen, Rep.ZambiaZimbabwe Linea del tempo:
Questa scala temporale mostra un grafico dal 1981 anno al 2016 anno. Uganda. I dati fino ad 1980 anno non disponibili. Il numero di osservazioni attuali secondo i date: 36.
La fonte (nome):
Indicatori dello sviluppo mondiale
La fonte (organizzazione):
International Monetary Fund, Balance of Payments Statistics Yearbook and data files.
Categorie:
Private Sector, Trade
sono stati aggiornati
23 apr 2017 anni
Indicatori delle variazioni dei valori per anni
Minima:
30.988
1 gen 2000 anni
Massimo:
87.303
1 gen 1985 anni
Alla data di osservazione
Valore
Variazione assoluta
La variazione rispetto al valore precedente
1 gen 1981 anni
68.878
+68.878
0.0%
1 gen 1982 anni
47.167
-21.711
-31.52%
1 gen 1983 anni
47.357
+0.189
0.4%
1 gen 1984 anni
51.36
+4.003
8.45%
1 gen 1985 anni
87.303
+35.943
69.98%
1 gen 1986 anni
66.631
-20.672
-23.68%
1 gen 1987 anni
56.014
-10.616
-15.93%
1 gen 1988 anni
50.61
-5.405
-9.65%
1 gen 1989 anni
51.62
+1.01
2.0%
1 gen 1990 anni
57.559
+5.939
11.51%
1 gen 1991 anni
58.341
+0.782
1.36%
1 gen 1992 anni
36.216
-22.125
-37.92%
1 gen 1993 anni
39.532
+3.316
9.16%
1 gen 1994 anni
37.87
-1.662
-4.2%
1 gen 1995 anni
38.001
+0.132
0.35%
1 gen 1996 anni
38.226
+0.224
0.59%
1 gen 1997 anni
35.46
-2.765
-7.23%
1 gen 1998 anni
36.165
+0.705
1.99%
1 gen 1999 anni
37.165
+1.0
2.76%
1 gen 2000 anni
30.988
-6.178
-16.62%
1 gen 2001 anni
32.781
+1.794
5.79%
1 gen 2002 anni
31.982
-0.799
-2.44%
1 gen 2003 anni
33.267
+1.285
4.02%
1 gen 2004 anni
64.944
+31.677
95.22%
1 gen 2005 anni
56.937
-8.007
-12.33%
1 gen 2006 anni
59.736
+2.799
4.92%
1 gen 2007 anni
62.117
+2.381
3.99%
1 gen 2008 anni
64.946
+2.83
4.56%
1 gen 2009 anni
71.878
+6.932
10.67%
1 gen 2010 anni
64.71
-7.168
-9.97%
1 gen 2011 anni
59.696
-5.014
-7.75%
1 gen 2012 anni
48.945
-10.751
-18.01%
1 gen 2013 anni
51.255
+2.309
4.72%
1 gen 2014 anni
43.818
-7.437
-14.51%
1 gen 2015 anni
42.793
-1.025
-2.34%
1 gen 2016 anni
42.821
+0.028
0.07%
Classificazione dei paesi secondo i statistiche attuali per anni


Commenti: